Create a Subset Data Table from a Report
These two methods produce linked subsets of a data table.
Use a Histogram
Once you have produced output that contains a histogram (by selecting Analyze > Distribution), you can use the histogram to create a new data table. The new data table contains the data in the histogram’s highlighted bars.
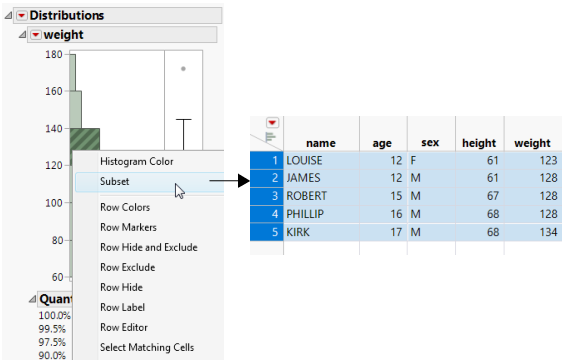
To create a subset, double-click a highlighted bar. Or, right-click anywhere in the histogram and select Subset from the menu. The subset table appears.
Figure 6.4 Subset Created from a Histogram
Note: The subset data table contains a view of the data, not the actual data. You must explicitly save the table if you want a copy. Note that the saved copy of the data table is no longer linked to the source table.
Using a Pareto Plot
Once you have produced output that contains a Pareto Plot (by selecting Analyze > Quality and Process > Pareto Plot), you can use the Pareto Plot to create a new data table. The new data table contains the data in the Pareto Plot’s highlighted bars. To create a subset, double-click a highlighted bar.