Create the Design
Note: In order to introduce and describe the Custom Design outlines, this example works through the outlines in succession.
To create the custom design, follow the steps in these sections:
• Factors
• Model
• Duplicate Results (Optional)
• Design
For information about the complete DOE workflow, see The DOE Workflow: Describe, Specify, Design in the Starting Out with DOE section.
Responses
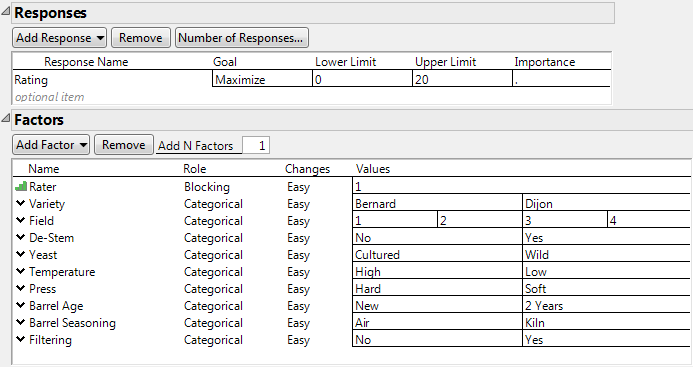
Add your response, the response Goal, and, if appropriate, the Lower Limit, Upper Limit, and Importance. Here, the response is Rating.
1. Select DOE > Custom Design.
2. Double-click Y under Response Name and type Rating.
Note that the default Goal is Maximize. Because you want to maximize the taste rating, do not change the goal.
3. Click under Lower Limit and type 0.
The least desirable rating is 0.
4. Click under Upper Limit and type 20.
The most desirable rating is 20.
5. Leave the area under Importance blank.
Because there is only one response, that response is given Importance 1 by default.
Figure 4.2 shows the completed Responses outline.
Factors
Enter factors either manually or automatically using a pre-existing table that contains the factors and settings.
• If you are designing a new experiment, you must first enter the factors manually. See Entering Factors Manually.
• Once you have saved the factors using the Save Factors option, you can load them automatically using the saved table. See Entering Factors Using Load Factors.
Both methods add these four outlines to the Custom Design window: Define Factor Constraints, Model, Alias Terms, and Design Generation.
Entering Factors Manually
1. First, add the blocking factor, Rater. Click Add Factor > Blocking > 8 runs per block.
2. Type Rater over the default Name of X1.
Note that Role is set to Blocking. Note also that only one setting for Values appears. This is because the number of blocks cannot be determined until the desired number of runs is specified. Once you specify the Number of Runs in the Design Generation outline, the number of levels for Rater updates to what is required.
3. Click Add Factor > Categorical > 2 Level.
4. Type Variety over the default Name of X2.
Note that Role is set to Categorical, as requested, and that Changes is set to Easy by default.
5. Click L1 and L2 and change them to Bernard and Dijon.
6. Click Add Factor > Categorical > 4 Level.
7. Type Field over the default Name of X3.
8. Click L1, L2, L3, and L4, and change them to 1, 2, 3, and 4.
9. Click Add Factor > Categorical > 2 Level.
10. Type De-Stem over the default Name of X4.
11. Click L1 and L2 and change them to No and Yes.
Add the rest of the factors as follows:
12. Type 6 next to Add N Factors, and then click Add Factor > Categorical > 2 Level.
13. Type the following names and values over the default ones:
– Yeast (Cultured and Wild)
– Temperature (High and Low)
– Press (Hard and Soft)
– Barrel Age (New and Two Years)
– Barrel Seasoning (Air and Kiln)
– Filtering (No and Yes)
Figure 4.2 Completed Responses and Factors Outlines
14. Click Continue.
The following outlines are added to the Custom Design window:
• Define Factor Constraints (not used in this example)
• Model
• Alias Terms
• Design Generation
Entering Factors Using Load Factors
To enter factors using a table containing factor information, proceed as follows:
1. Select Help > Sample Data Library and open Design Experiment/Wine Factors.jmp.
2. Click the Custom Design red triangle and select Load Factors.
After loading the factors, the Custom Design window automatically updates. The following outlines are added to the Custom Design window:
• Define Factor Constraints (not used in this example)
• Model
• Alias Terms
• Design Generation
Model
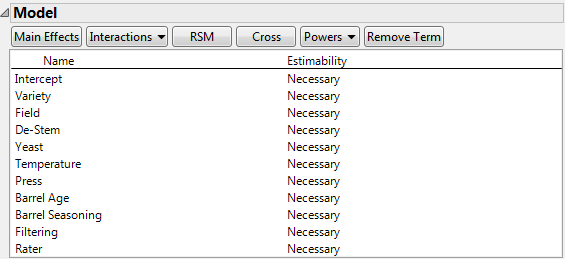
The Model outline shows all main effects as Necessary, indicating that the design needs to be capable of estimating all main effects. For this example, your assumed model reflects your interest in main effects only. However, if you wanted to estimate other effects, you could add them to the Model outline. For more information about models, see Model.
Figure 4.3 Model Outline
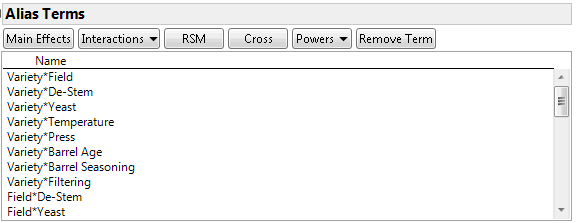
Alias Terms
The Alias Terms outline specifies the effects to be shown in the Alias Matrix, which appears later. The Alias Matrix shows the aliasing relationships between the Model terms and the effects listed in the Alias Terms outline. Open the Alias Terms outline node to verify that all two-factor interactions are listed. For more information about the alias matrix, see Alias Matrix.
Figure 4.4 Partial View of the Alias Terms Outline
Duplicate Results (Optional)
In the next step, you generate your design. Because the Custom Design algorithm begins with a random starting design, your design might differ from the one shown in Figure 4.5. If you want to obtain a design with exactly the same runs and run order, perform the following steps:
1. Click the Custom Design red triangle and select Set Random Seed.
2. Type 100526291 (the random seed).
3. Click OK.
4. Click the Custom Design red triangle and select Number of Starts.
5. Type 2.
6. Click OK.
Note: Setting the Random Seed and Number of Starts reproduces the exact results shown in this example. In constructing a design on your own, these steps are not necessary.
Proceed to the Design Generation section.
Design Generation
In the Design Generation outline, you can enter additional details about the structure and size of your design. In this example, the Default design shows 16 runs. But you have five raters, each of whom can sample eight wines. This means that you want a design with 40 runs. Change the number of runs as follows:
1. Under Number of Runs, type 40 in the User Specified box.
Because you do not want to replicate runs, leave the Number of Replicate Runs set to 0.
2. Click Make Design.
The Design and Design Evaluation outlines are added to the Custom Design window. The Output Options panel also appears.
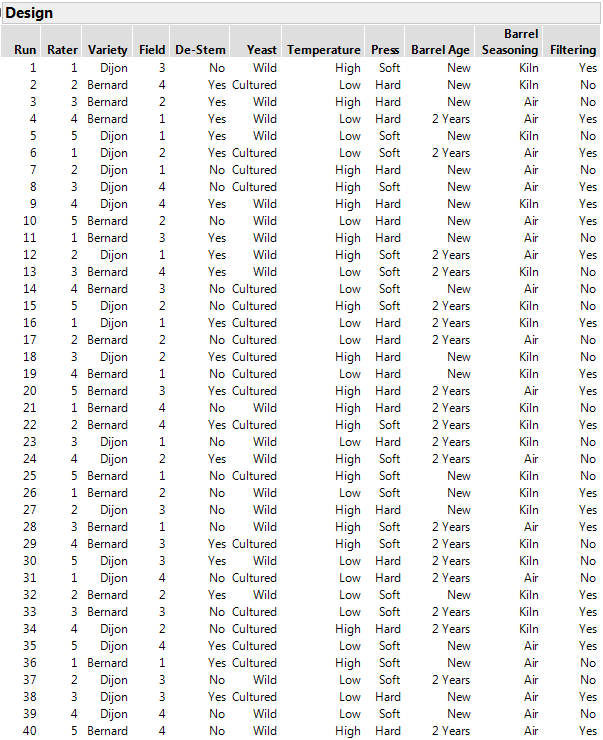
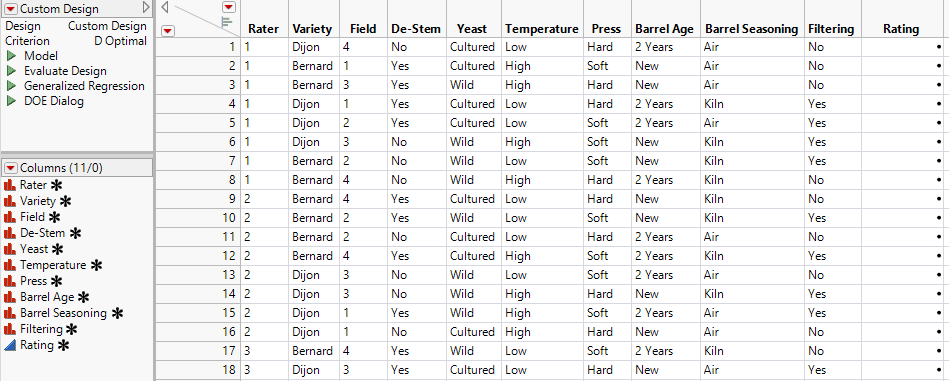
Design
The Design outline shows the runs in the design that you have constructed. Later, you are able to randomize the order under Output Options. For now, verify that this design is appropriate for your experiment. For example, check that each of five Raters evaluates eight wines, that all necessary factors are shown, and that none of the settings represent infeasible combinations.
Figure 4.5 Design for Wine Experiment
Design Evaluation
The Design Evaluation outline provides different ways to evaluate your design.
Note: For more information about the Design Evaluation outline, see Evaluate Designs.
For this example, open the Design Evaluation outline, and examine the Color Map on Correlations, the Alias Matrix, and Design Diagnostics.
Color Map on Correlations
The Color Map on Correlations shows the absolute value of the correlation between any two effects that appear in either the Model or the Alias Terms outline.
Figure 4.6 Color Map on Correlations
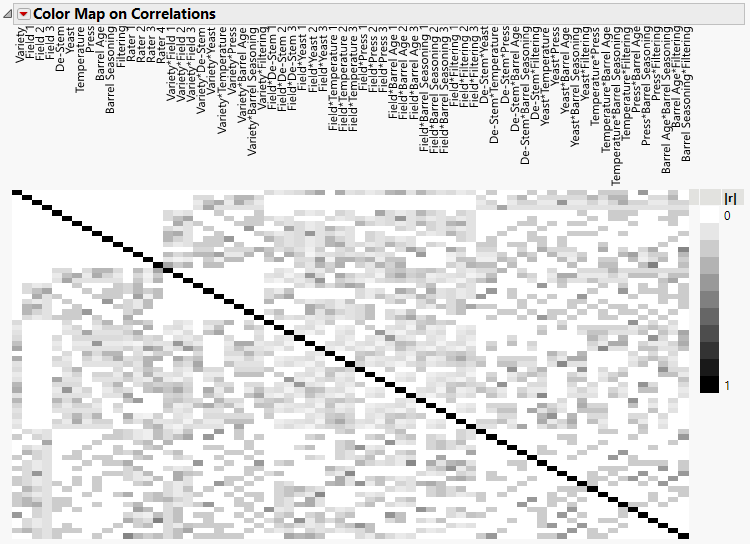
The main effects are represented by the 15 terms in the upper left corner of the map. The white corresponding to the correlations of main effects with other main effects indicate correlations of 0. This means that all main effects are orthogonal and can be estimated independently.
The only black in Figure 4.6 is on the main diagonal. The color indicates absolute correlations of one, reflecting that each term is perfectly correlated with itself. It follows that no main effect is completely confounded with any two-way interaction. In fact, the absolute values of the correlations of main effects with two-way interactions are fairly low. This means that estimates of main effects might be only slightly biased by the presence of active two-way interactions.
Tip: Position your mouse pointer over cells in the color map to see the absolute correlations between effects. Right-click below the legend to save the correlations to a data table.
Alias Matrix
In the Alias Matrix, model effects are listed in the column on the left. For a given model effect, a column entry indicates the degree to which the column effect (if active) biases the estimate of the model effect.
Figure 4.7 Partial View of Alias Matrix
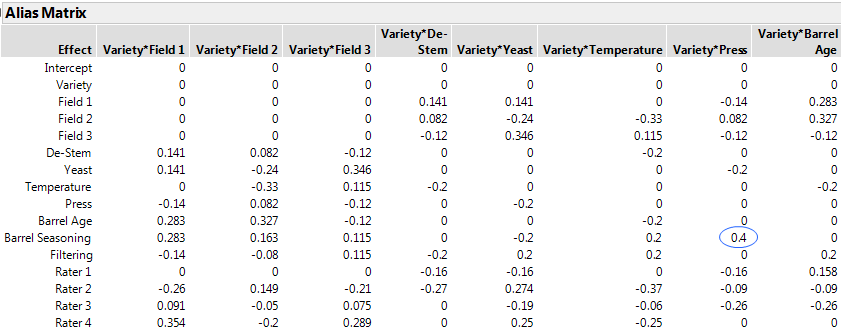
For example, consider the model effect Barrel Seasoning. If Variety*Press is active, then the expected value of the estimate for the Barrel Seasoning effect differs from an unbiased estimate of that effect. The amount by which it differs is equal to 0.4 times the effect of Variety*Press. Therefore, what appears to be a significant Barrel Seasoning estimated effect could in reality be a significant Variety*Press effect.
Design Diagnostics
The Design Diagnostics outline provides information about the efficiency of the design. Efficiency measures compare your design to a theoretically optimal design, which might not exist. The efficiency values are ratios, expressed as percents, of the efficiency of your design to the efficiency of this optimal design. For more information about the efficiency measures, see Estimation Efficiency in the Evaluate Designs section.
Figure 4.8 Design Diagnostics Outline
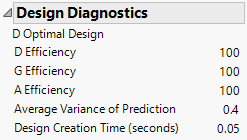
Notice that the D-, G-, and A-efficiency values are all 100%. Because your design is orthogonal for main effects, the design is optimal for the main effects model relative to all three efficiency criteria.
The first line in the Design Diagnostics outline indicates that your design was constructed to optimize the D-efficiency criterion. See the Optimality Criterion description in Custom Design Options. In this case, your design has D Efficiency of 100%.
Output Options
Specify the order of runs in your data table using the Output Options panel. The default selection, Randomize within Blocks, is appropriate for this example. Simply click Make Table.
A Custom Design table is created and opens, similar to the one in Figure 4.9.
Note: Your table might look different because the algorithm that creates it uses a random starting design. To obtain the precise table shown in Figure 4.9, follow the steps in Duplicate Results (Optional).
Figure 4.9 Custom Design Table
Note the following:
• In the Table panel, the Model, Evaluate Design, and DOE Dialog scripts are added during the design creation process. The Model script opens a Fit Model window containing the effects that you specified as Necessary in the Custom Design dialog. The DOE Dialog script re-creates the window used to generate the design table.
• In the Columns panel, the asterisks to the right of the factors and response indicate column properties that have been saved to the columns in the data table. These column properties are used in the analysis of the data. For more information about column properties, see Factors and Factor Column Properties.