Creating a Space-Filling Design for a Map Shape
A fast flexible filling (FFF) design can be used to design an experiment to be executed across a region such as a map shape. For example, if you had two sample collection methods (perhaps for air or soil samples) that you wanted to compare at locations spread through out a US state, consider a FFF design.
Supposed the US state of interest is Georgia. You want 40 samples, 20 for each sampling method, spread throughout the state.To create a FFF design for a map shape, you need a file with the latitude and longitude of the map boundaries (see Background Maps in the Maps section).
In the following example, you determine the longitude and latitude for the US state of Georgia, define the shape of the state, then create the design. The design will provide the location and the sampling method for each of your 40 samples.
Find Longitude and Latitude for Georgia
1. Navigate to the Maps directory, usually found here:
Windows: C:/Program Files/SAS/JMP/<Version>/Maps
macOS: /Library/Application Support/JMP/<Version>/Maps
2. Open US-State-XY.jmp and US-State-Name.jmp.
Notice that in US-State-Name.jmp, Shape ID 11 corresponds to the US state of Georgia. In this example, that is the state of interest.
3. In US-State-XY.jmp, select Rows > Row Selection > Select Where...
4. Select Shape ID and enter 11 in the text box, then click OK.
This selects all rows with a Shape ID of 11, representing Georgia.
5. Select Tables > Subset and click OK to obtain a subset of the US-State-XY.jmp table of the latitudes and longitudes data for the state of Georgia (the selected rows).
6. Close US-State-XY.jmp and US-State-Name.jmp.
Get the Range of Values
To define the space for the space filling design, you need to know the range of values for the latitude and longitudes in Georgia.Then, you can create design factors with these values.
1. Select File > New > Script. In the script window, right-click and select Show Embedded Log.
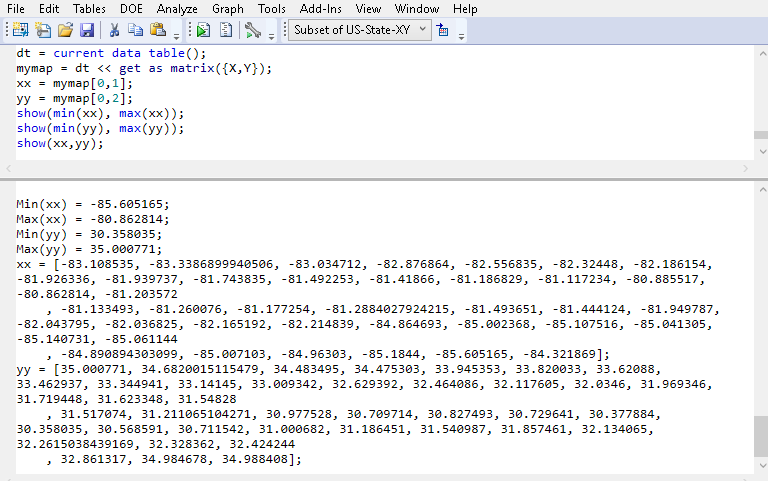
2. Copy the following and paste it into the new script:
dt = current data table();
mymap = dt << get as matrix({X,Y});
xx = mymap[0,1];
yy = mymap[0,2];
show(min(xx), max(xx));
show(min(yy), max(yy));
show(xx,yy);
3. With the subset of the US-State-XY.jmp table active, run the script.
The range of values for the latitudes and longitudes in Georgia and the xx and yy matrices appear in the log.
Figure 21.25 Range Finding Script and Results in Log
Add Factors
1. Select DOE > Special Purpose > Space Filling Design.
2. Add two continuous factors to the design. Enter 2 in the Add N Factors text box and click Continuous.
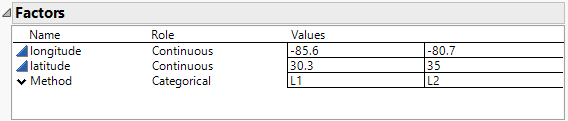
3. Rename the factors longitude and latitude. Enter the min and max values, as follows:
– For longitude, enter -85.6 and -80.9 as the values. These are the min and max longitude values from the log for x.
– For latitude, enter 30.4 and 35.0 as the values. These are the min and max latitude values from the log for y.
4. Add a categorical factor. Click Categorical > 2 Level. Rename the factor Method.
Figure 21.26 Factors
5. Click Continue.
Define the Shape
To further define the space for the space filling design, you need to define the shape of the state using a polygon.
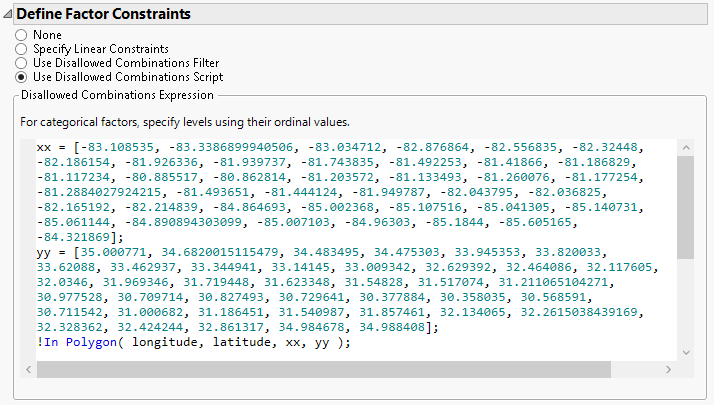
1. Select Use Disallowed Combinations Script to open the Disallowed Combinations Expression text box.
The ranges of longitude and latitude define a square. The state of Georgia is a polygon, not a square. You want to disallow points that fall outside of the state of Georgia polygon.
2. Go to your script window and copy the xx and yy matrices from your script log. Paste this into the Disallowed Combinations Expression text box.
3. At the end, add the following line:
!In Polygon(longitude, latitude , xx, yy);
This excludes points that are not in the polygon defined by the xx and yy coordinates.
Figure 21.27 Disallowed Combinations Expression
Make the Design
1. Change the Number of Runs to 40 and click Fast Flexible Filling.
2. Click Make Table.
3. From your design table, select Graph > Graph Builder.
4. Drag these columns into these zones:
– longitude to the X zone
– latitude to the Y zone
– Method to the Color zone
5. Above the graph, click the Smoother element icon to turn it off.
6. To add the state shape, right-click the graph and select Graph > Background Map.
7. Under Boundaries, select US States and click OK.
Figure 21.28 Example of FFF Design for the US State of Georgia
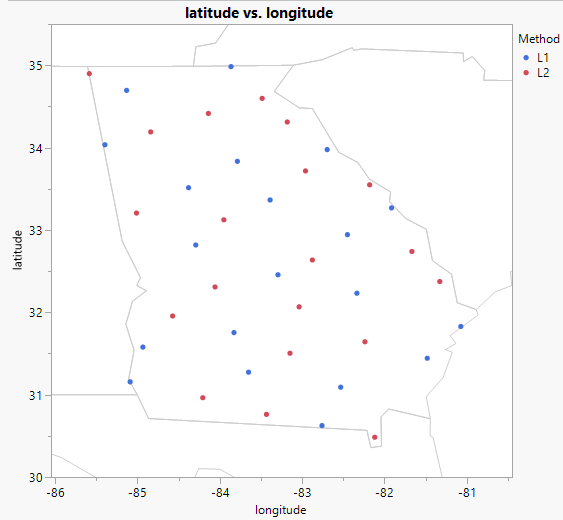
Note: The exact location of the points on your map may differ from the one shown due to the random starting point for the FFF algorithm.
The map identifies the 40 locations where you should collect your samples. The sampling method (L1 or L2) is indicated by the color of the points.
The Graph > Background Map window has these additional options:
• To determine the counties for your testing, under Boundaries, select US Counties.
• To map your testing locations at the street level, under Images, select Street Map Service.