Cross Validation Report
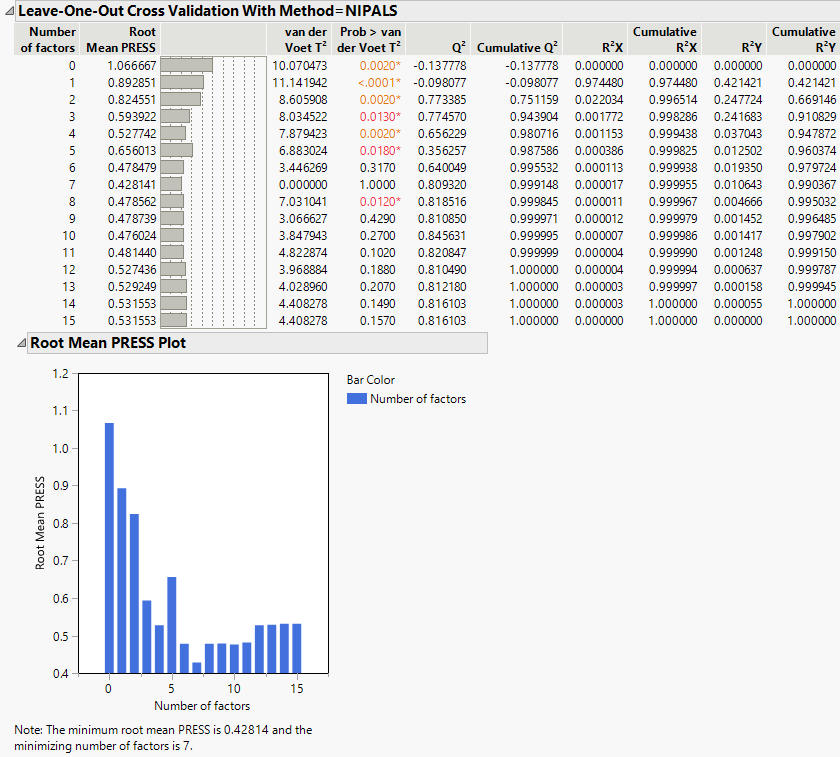
This report appears only when a form of cross validation is selected as a Validation Method in the Model Launch control panel. The report title is dynamically named <Cross Validation Method> With <Method = Method Specification>, depending on the cross validation and method options selected in the control panel. It shows summary statistics for models fit, using from 0 to the maximum number of extracted factors, as specified in the Model Launch control panel. The report also provides a plot of Root Mean PRESS values. See Root Mean PRESS Plot. An optimum number of factors is identified using the minimum Root Mean PRESS statistic.
Figure 6.9 Cross Validation Report
 When the Standardize X option is selected, the standardization is applied once to the entire data table. It is not reapplied to the individual training sets. However, when any combination of the Centering or Scaling options are selected, this combination of selections is applied to each cross validation training set. Cross validation proceeds by using the training sets, which are individually centered and scaled if these options are selected.
The following statistics are shown in the report. If any form of validation or cross validation is used, the reported results are summaries of the training set statistics.
Number of Factors
The number of factors used in fitting the model.
Root Mean PRESS
The square root of the average of the PRESS values across all responses. See Root Mean PRESS.
van der Voet T2
The test statistic for the van der Voet test, which tests whether models with different numbers of extracted factors differ significantly from the optimum model. The null hypothesis for each van der Voet T2 test states that the model based on the corresponding number of factors does not differ from the optimum model. The alternative hypothesis is that the model does differ from the optimum model. See van der Voet T2.
Prob > van der Voet T2
The p-value for the van der Voet T2 test. See van der Voet T2.
Q2
Dimensionless measure of predictive ability defined by subtracting the ratio of the PRESS value divided by the total sum of squares for Y from one:
1 − PRESS/SSY
See Calculation of Q2.
Cumulative Q2
Indicator of the predictive ability of models with the given number of factors or fewer. For a given number of factors, f, Cumulative Q2 is defined as follows:
 (Pressi/SYYi)
Here PRESSi and SSYi correspond to their values for i factors.
R2X
Percent of X variation explained by the specified factor. A component with a large R2X explains a large amount of the variation in the X variables. See Calculation of R2X and R2Y When Validation Is Used.
Cumulative R2X
Percent of X variation explained by the model with the given number of factors. This is the sum of the R2X values for i = 1 to the given number of factors.
R2Y
Percent of Y variation explained by the specified factor. A component with a large R2Y explains a large amount of the variation in the Y variables. See Calculation of R2X and R2Y When Validation Is Used.
Cumulative R2Y
Percent of Y variation explained by the model with the given number of factors. This is the Sum of the R2Y values for i = 1 to the given number of factors.
Interpretation of Q2 and Cumulative R2Y
The statistics Q2 and Cumulative R2Y both measure the predictive ability of the model, but in different ways.
• Cumulative R2Y increases as the number of factors increases. This is because, as factors are added to the model, more variation is explained.
• Q2 tends to increase and then decrease, or at least discontinue increasing, as the number of factors increases. This is because, as more factors are added, the model becomes tuned to the training set and does not generalize well to new data, causing the PRESS statistic to decrease.
Analysis of Q2 and Cumulative R2Y provides an alternative to using the van der Voet test for determining how many factors to include in your model. Select a number of factors for which Q2 is large and has not started decreasing. You also want Cumulative R2Y to be large.
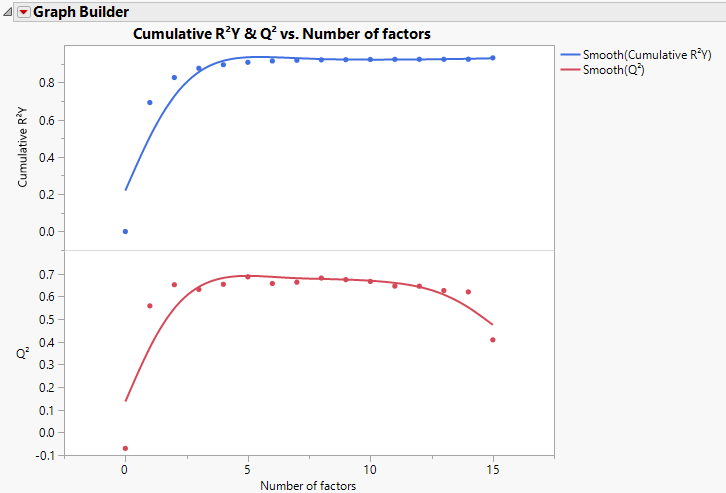
Figure 6.10 shows plots of Cumulative R2Y and Q2 against the number of factors for the Penta.jmp data table, using Leave-One-Out as the validation method. Cumulative R2Y increases and levels off for about four factors. The statistic Q2 is largest for two factors and then begins to level off. The plot suggests that a model with two factors explains a large portion of the variation in Y without overfitting the data.
Figure 6.10 Cumulative R2Y and Q2 for Penta.jmp
Root Mean PRESS Plot
This bar chart shows the number of factors along the horizontal axis and the Root Mean PRESS values on the vertical axis. It is equivalent to the horizontal bar chart that appears to the right of the Root Mean PRESS column in the Cross Validation report (Figure 6.9).
Root Mean PRESS
For a specified number of factors, a, Root Mean PRESS is calculated as follows:
1. Fit a model with a factors to each training set.
2. Apply the resulting prediction formula to the observations in the validation set.
3. For each Y:
– For each validation set, compute the squared difference between each observed validation set value and its predicted value (the squared prediction error).
– For each validation set, average these squared differences and divide the result by a variance estimate for the response calculated as follows. For the KFold and Leave-One-Out validation methods, divide by the variance of the entire response column. For Holdback validation, divide by the variance of the response values in the training set.
– Sum these means and, in the case of more than one validation set, divide their sum by the number of validation sets minus one. This is the PRESS statistic for the given Y.
4. Root Mean PRESS for a factors is the square root of the average of the PRESS values across all responses.
5. The PRESS statistic for multiple Ys is obtained by averaging the PRESS statistic, obtained in step 3, across all responses.
Calculation of Q2
The statistic Q2 is defined as 1 - PRESS / SSY. The PRESS statistic is the predicted error sum of squares averaged across all responses for the model developed based on the training data, but evaluated on the validation set. The value of SSY is the sum of squares for Y averaged across all responses and based on the observations in the validation set.
The statistic Q2 in the Cross Validation report is computed in the following ways, depending on the selected Validation Method:
Leave-One-Out
Q2 is the average of the values 1 - PRESS / SSY computed for the validation sets based on the models constructed by leaving out one observation at a time.
KFold
Q2 is the average of the values 1 - PRESS / SSY computed for the validation sets based on the K models constructed by leaving out each of the K folds.
Holdback or Validation Set
Q2 is the value of 1 - PRESS / SSY computed for the validation set based on the model constructed using the single set of training data.
Calculation of R2X and R2Y When Validation Is Used
The statistics R2X and R2Y in the Cross Validation report are computed in the following ways, depending on the selected Validation Method:
Note: For all of these computations, R2Y is calculated analogously.
Leave-One-Out
R2X is the average of the Percent Variation Explained for X Effects for the models constructed by leaving out one observation at a time.
KFold
R2X is the average of the Percent Variation Explained for X Effects for the K models constructed by leaving out each fold.
Holdback or Validation Set
R2X is the Percent Variation Explained for X Effects for the model constructed using the training data.