Decomposition Reports
This section provides details about the reports obtained from the three decomposition options:
Linear Trend Report
Contains the values of β0 and β1 from the linear regression model that is fit to the data:
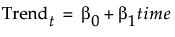
The detrended series is equal to Dt = Ot - Trendt, where Ot is the original time series.
Cycle Report
Contains the values of the cyclical component that is fit to the data:
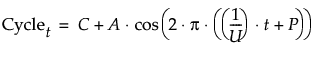
The parameter values are defined as follows:
• C is the (optional) Constant
• A is the Amplitude of the cosine wave
• U is the number of Units per Cycle
• P is the Phase of the cosine wave
• t is one less than the row number of a given observation
The decycled series is equal to Dt = Ot - Cyclet, where Ot is the original time series.
X11 Report
Depending on your selection of Decomposition Type, the X11 option adds an X11 - Multiplicative report or an X11 - Additive report. The reports contain the same four plots:
Original and Adjusted
Overlays the X11-adjusted time series on the original time series, Ot. The X11-adjusted values are Ot/St for the multiplicative adjustment and Ot - St for the additive adjustment.
D10 - Final Seasonal Factors
Plots the seasonal factor components, St, over time.
D12 - Final Trend Cycle
Plots the trend cycle components, Ct, over time.
D13 - Final Irregular Series
Plots the irregular components, It, over time.
X11 Report Options
The X11 reports have the following red triangle options:
Show Tables
Shows or hides the X11 summary tables, as described in Shiskin et. al. (1967). The tables are grouped into five categories (labeled B through F), described in Table 17.1.
Save Columns
Saves four columns to the data table: the seasonally adjusted time series, the seasonal components (St), the trend cycle components (Ct), and the irregular series components (It).
Save All Columns
Saves columns to the data table for all of the tables produced in the report by the Show Tables option.
Letter Prefix | Category Description |
|---|---|
B | preliminary estimates of seasonal, trend cycle, and irregular components |
C | intermediate estimates of seasonal, trend cycle, and irregular components |
D | final estimates of seasonal, trend cycle, and irregular components |
E | analytical tables |
F | summary measures |
For more information about the contents of the X11 output tables, see Shisken et. al. (1967) or SAS/ETS 13.1 User’s Guide (search for “The output from PROC X11”).