Design Diagnostics
The Design Diagnostics outline shows D-, G-, and A-efficiencies and the average variance of prediction. These diagnostics are not shown for designs that include factors with Changes set to Hard or Very Hard or effects with Estimability designated as If Possible.
When Design Diagnostics is accessed from a DOE platform other than Evaluate Design, the Design Creation Time gives the amount of time required to create the design. When Design Diagnostics is accessed from the Evaluate Design platform, Design Creation Time gives the amount of time required for the Evaluate Design platform to calculate results.
Figure 15.25 shows the Design Diagnostics outline for the Bounce Data.jmp sample data table, found in the Design Experiment folder.
Figure 15.25 Design Diagnostics Outline
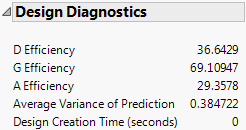
Caution: The efficiency measures should not be interpreted on their own. But they can be used to compare designs. Given two designs, the one with the higher efficiency measure is better. While the maximum efficiency is 100 for any criterion, an efficiency of 100% is impossible for many design problems.
Notation
The descriptions of the efficiency measures given below use the following notation:
• X is the model matrix
• n is the number of runs in the design
• p is the number of terms, including the intercept, in the model
•  is the relative prediction variance at the point
  . See Relative Prediction Variance in the Technical Details section.
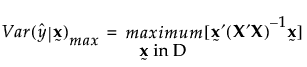
•  is the maximum relative prediction variance over the design region
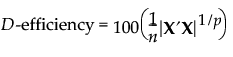
D Efficiency
The efficiency of the design to that of an ideal orthogonal design in terms of the D-optimality criterion. A design is D-optimal if it minimizes the volume of the joint confidence region for the vector of regression coefficients:
G Efficiency
The efficiency of the design to that of an ideal orthogonal design in terms of the G-optimality criterion. A design is G-optimal if it minimizes the maximum prediction variance over the design region:
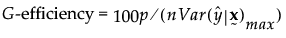
Letting D denote the design region,
Note: G-Efficiency is calculated using Monte Carlo sampling of the design space. Therefore, calculations for the same design may vary slightly.
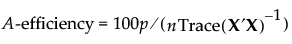
A Efficiency
The efficiency of the design to that of an ideal orthogonal design in terms of the A-optimality criterion. A design is A-optimal if it minimizes the sum of the variances of the regression coefficients:
Average Variance of Prediction
At a point  in the design space, the relative prediction variance is defined as:
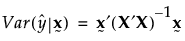
Note that this is the prediction variance divided by the error variance. For more information about the calculation, see Section 4.3.5 in Goos and Jones (2011).
Design Creation Time
Design Creation Time gives the amount of time required for the Evaluate Design platform to calculate results.