Design with a Linear Time Trend
Often, experiments conducted in a time sequence experience a linear drift in the response. If you randomize the order of the runs, then the drift’s effect does not generally bias the estimated factor effects. However, by accounting for the drift, you can reduce the variance of those effects.
Suppose that there is reason to suspect a strong linear trend in the response over time independent of the factor changes. Then you can construct a design that includes a linear covariate to account for the trend. The resulting design is optimal, given this trend covariate.
In this example, you design an experiment for 7 factors. You construct a 16-run design that is robust to linear trend.
1. Select File > New > Data Table.
2. Right-click Column1 and select Column Info.
3. Change the column name to Run Order.
4. From the list of Initialize Data options, select Sequence Data.
5. Type 16 next to To.
6. Click OK.
Consecutive integers from 1 to 16 have been entered in the data table.
7. Select DOE > Custom Design.
8. Click Add Factor > Covariate.
9. Select Run Order and click OK.
10. Type 7 next to Add N Factors.
11. Click Add Factor > Continuous.
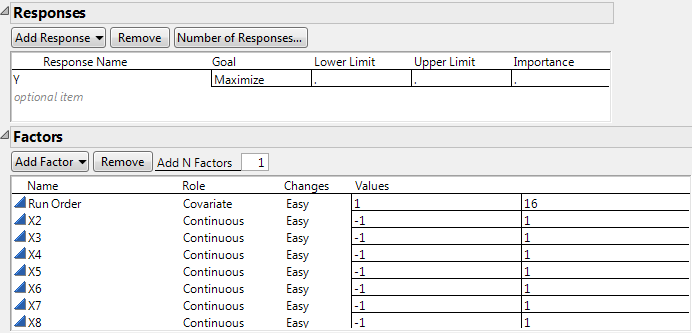
Figure 5.68 Responses and Factors Outlines
12. Click Continue.
13. Open the Alias Terms outline.
14. Select all of the effects in the list and click Remove Term.
This omits the interaction effects from the correlation color map, leaving only the main effects.
Note: Setting the Random Seed in step 15 and Number of Starts in step 16 reproduces the exact results shown in this example. In constructing a design on your own, these steps are not necessary.
15. (Optional) Click the Custom Design red triangle, select Set Random Seed, type 1084680980, and click OK.
16. (Optional) Click the Custom Design red triangle, select Number of Starts, type 30000, and click OK.
17. Click Make Design.
A progress bar displays elapsed time and D Efficiency.
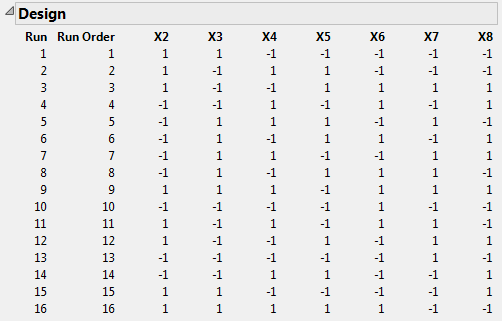
Figure 5.69 Design Outline
18. Open the Design Evaluation > Color Map On Correlations outline.
Figure 5.70 Color Map Showing Absolute Correlations with Run Order
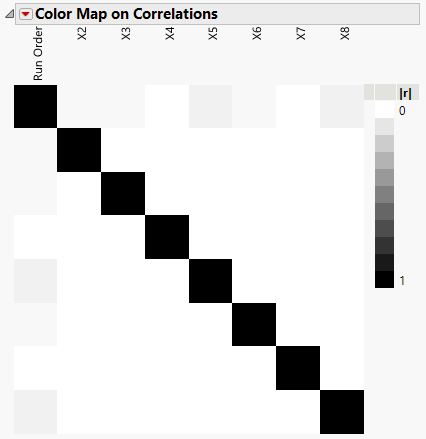
The Color Map shows the following:
– The seven continuous factors, X2 through X8, are orthogonal to each other.
– Run Order, the linear time trend variable, has extremely low absolute correlation with X2 through X8.
19. Open the Design Evaluation > Estimation Efficiency outline.
Figure 5.71 Estimation Efficiency Outline
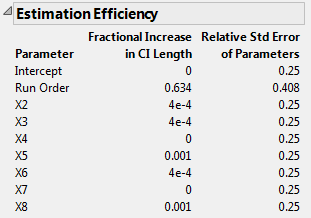
The small absolute correlations of Run Order with X2 through X8 result in very small increases in confidence interval lengths, relative to an ideal orthogonal design. The increases in the lengths of confidence intervals for X2 through X8 are all less than 0.1%.
In this example, the run order factor is nearly orthogonal to the factor effects. In some cases, your design might have more substantial correlations between the run order factor and other factors. Even in such a situation, including the run order as a factor accounts for any linear trend effect. Including the run order also allows for more precise estimation of the other factor effects.