Ellipse
The Ellipse element ![]() shows a bivariate normal density ellipse.
shows a bivariate normal density ellipse.
Figure 3.28 Ellipse Options
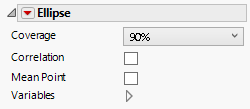
Coverage
Specifies the coverage percentage (99%, 95%, 90%, or 50%) for the density ellipse.
Correlation
Shows the Pearson correlation coefficient for the X and Y variables on the graph.
Mean Point
Shows the mean on the graph.
Variables
Shows or hides graph elements for variables, or re-orders the display of variables.
Note: These options do not apply to variables in the Group X, Group Y, Wrap, or Page zones.
Check boxes are followed by the zone designation and the name of the variable. Use check boxes to do the following:
– Show or hide the elements corresponding to a variable in a zone.
– Add or remove the effect of applying the Color, Size, Shape, or Freq variable to the variable in the zone.
Tip: If you have multiple graphs, you can color or size each graph by different variables. Drag a second variable to the Color or Size zone, and drop it in a corner. In the Variables option, select the specific color or size variable to apply to each graph.
Use arrows to re-order the display if there are multiple variables in a zone. Highlight a variable name and click an arrow to reposition it.
For an example using Variables, see Example of an Area and Line Chart in the Graph Builder Examples section.
Red Triangle Option for Ellipse
Adapt to Axis Scale
For log and other axis transformations, applies computations on the transformed coordinates.