Example Comparing Matched Pairs across Groups
This example uses the Dogs.jmp sample data table. This example shows you how to produce both a Matched Pairs Across Groups report and the corresponding MANOVA report using Fit Model.
1. Select Help > Sample Data Library and open Dogs.jmp.
2. Select Analyze > Specialized Modeling > Matched Pairs.
3. Select LogHist0 and LogHist1 and click Y, Paired Response.
4. Select drug and click X, Grouping.
5. Click OK.
The report on the left in Figure 19.5 appears.
Now produce the Fit Model report using the same data table.
1. Select Analyze > Fit Model.
2. Select LogHist0 and LogHist1 and click Y.
3. Select drug and click Add.
4. Select the Manova personality.
5. Click Run Model.
6. In the Response Specification report, select Repeated Measures from the Choose Response menu.
7. Click OK.
Figure 19.5 Examples of Matched Pairs across Groups and Fit Model MANOVA with Repeated Measures
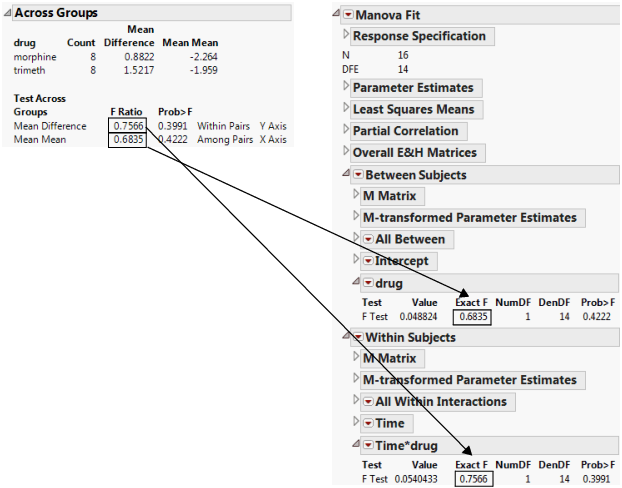
The F Ratio for the Mean Difference in the Across Groups report corresponds to the F Ratio for Time*drug under the Within Subjects report. The F Ratio for the Mean Mean in the Across Groups report corresponds to the F Ratio for drug under Between Subjects in the Manova Fit report.