Example of Changing Preferences
Every platform report window has options that you can turn on or off. However, your changes to these options are not remembered the next time you use the platform. If you want JMP to remember your changes every time you use the platform, change those options in the Preferences window.
This example shows how to set the Distribution platform so that an Outlier Box Plot is not added to the initial report.
Create a Distribution Using the Default Preference Setting
1. Select Help > Sample Data Library and open Companies.jmp.
2. Select Analyze > Distribution.
3. Select Profits ($M) and click Y, Columns.
4. Click OK.
Figure 8.7 Distribution Report Window
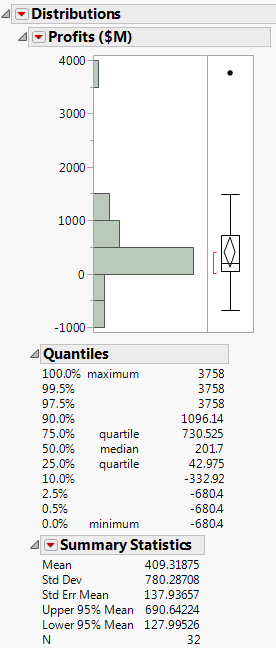
The histogram is vertical, and the graphs includes an outlier box plot. To change the histogram to horizontal and remove the outlier box, select the appropriate options from the red triangle menu for Profits ($M). However, if you want those preferences to be in effect every time you use the platform, then change them in the Preferences window.
Change the Preference for the Outlier Box Plot and Run Distribution Again
1. Select File > Preferences (Windows) or JMP > Preferences (macOS).
2. Select Platforms from the preference group.
3. Select Distribution from the Platforms list.
4. Select the Horizontal Layout option to turn it on.
5. Deselect the Outlier Box Plot option to turn it off.
Figure 8.8 Distribution Preferences
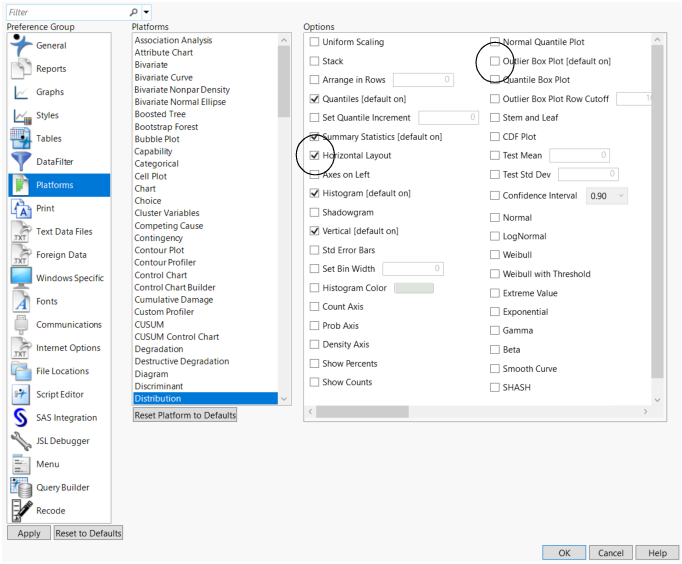
6. Click OK.
7. Repeat the Distribution analysis. See Create a Distribution Using the Default Preference Setting.
The histogram is now horizontal and the outlier box plot does not appear. These preferences remain the same until you change them.
For more information about all of the preferences, see JMP Preferences in Using JMP.