 Example of Generalized Regression
The data in the Diabetes.jmp sample data table consist of measurements on 442 diabetics. The response of interest is Y, disease progression measured one year after a baseline measure was taken. Ten variables thought to be related to disease progression are also measured at baseline. This example shows how to develop a predictive model using generalized regression techniques.
1. Select Help > Sample Data Library and open Diabetes.jmp.
2. Select Analyze > Fit Model.
3. Select Y from the Select Columns list and click Y.
4. Select Age through Glucose and click Macros > Factorial to Degree.
This adds all terms up to degree 2 (the default in the Degree box) to the model.
5. Select Validation from the Select Columns list and click Validation.
6. From the Personality list, select Generalized Regression.
7. Click Run.
The Generalized Regression report that appears contains a Model Comparison report, a Model Launch control panel, and a Normal Standard Least Squares with Validation Column report.
In the Model Launch control panel, note the following:
– The Response Distribution is set to Normal because you specified Normal as the Distribution in the Fit Model launch window.
– The default Estimation Method is the Lasso.
– The Validation Method is set to Validation Column because you specified a validation column in the Fit Model window.
8. Click Go.
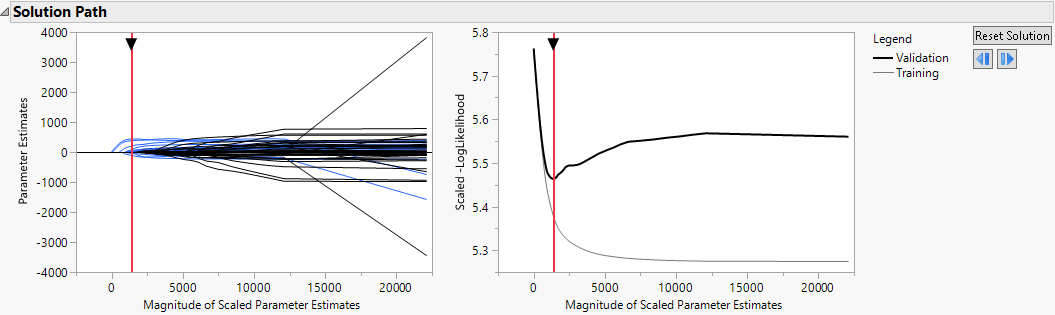
A Normal Lasso with Validation Column report appears. The Solution Path report (Figure 6.2) shows plots of the parameter estimates and scaled negative log-likelihood. The shrinkage increases as the Magnitude of Scaled Parameter Estimates decreases. The estimates at the far right of the plot are the maximum likelihood estimates. A vertical red line indicates those parameter values selected by the validation criterion, in this case, the holdback sample defined by the column Validation.
Figure 6.2 Solution Path Plot
9. Click the red triangle next to Normal Lasso with Validation Column and select Select Nonzero Terms.
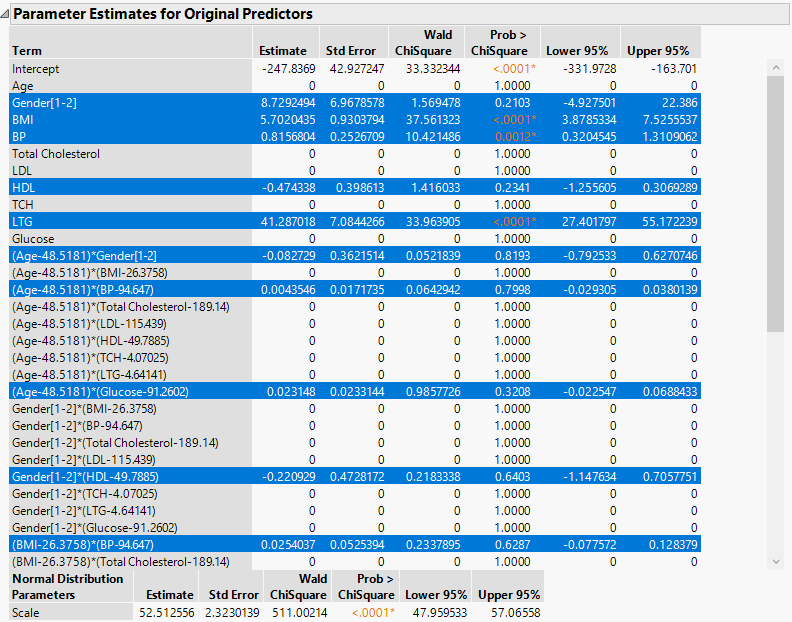
This option highlights the nonzero terms in the Parameter Estimates for Original Predictors report (Figure 6.3) and their paths in the Solution Path Plot. The corresponding columns in the data table are also selected. Note that only 11 of the 55 parameter estimates are nonzero. The scale parameter for the normal distribution (sigma) is also estimated and shown in a separate table at the bottom of the Parameter Estimates for Original Data report. Note that not all of the 55 parameter estimates appear in Figure 6.3.
Figure 6.3 Portion of Parameter Estimates for Original Predictors Report
To save the prediction formula, click the red triangle next to Normal Lasso with Validation Column report and select Save Columns > Save Prediction Formula.