Example of Inverse Prediction Using the Inverse Prediction Option
If your response has exactly two levels, the Inverse Prediction option enables you to request an exact inverse prediction. You are given the x value corresponding to a given probability of the lower response category, as well as a confidence interval for that x value.
To use the Inverse Prediction option, proceed as follows:
1. Select Help > Sample Data Library and open Penicillin.jmp.
2. Select Analyze > Fit Y by X.
3. Select Response and click Y, Response.
4. Select ln(dose) and click X, Factor.
Notice that JMP automatically fills in Count for Freq. Count was previously assigned the role of Freq.
5. Click OK.
6. Click the red triangle next to Logistic Fit of Response By ln(dose) and select Inverse Prediction (Figure 8.11).
7. Type 0.95 for the Confidence Level.
8. Select Two sided for the confidence interval.
9. Request the response probability of interest. Type 0.5 and 0.9 for this example, which indicates you are requesting the values for ln(dose) that correspond to a 0.5 and 0.9 probability of being cured.
10. Click OK.
The Inverse Prediction plot appears.
Figure 8.11 Inverse Prediction Window
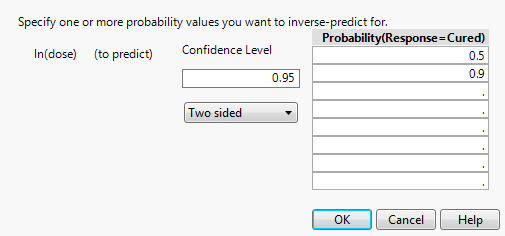
Figure 8.12 Example of Inverse Prediction Plot
The estimates of the x values and the confidence intervals are shown in the report as well as in the probability plot. For example, the value of ln(dose) that results in a 90% probability of being cured is estimated to be between -0.526 and 0.783.