Example of Making Design Decisions
You can use the Choice Modeling platform to determine the relative importance of product attributes. Even if the attributes of a particular product that are important to the consumer are known, information about preference trade-offs with regard to these attributes might be unknown. By gaining such information, a market researcher or product designer is able to incorporate product features that represent the optimal trade-off from the perspective of the consumer. This example illustrates the advantages of this approach to product design.
It is already known that four attributes are important for laptop design: hard-disk size, processor speed, battery life, and selling price. The data gathered for this study are used to determine which of four laptop attributes (Hard Disk, Speed, Battery Life, and Price) are most important. It also assesses whether there are Gender or Job effects associated with these attributes.
This example has the following sections:
Complete the Launch Window
1. Select Help > Sample Data Library and open Laptop Runs.jmp.
Note: If you prefer not to follow the manual steps in this section, click the green triangle next to the script Choice with Gender to run the model, and go to Analyze the Model.
2. Click the green triangle next to the Open Profile and Subject Tables script.
The script opens the Laptop Profile.jmp and Laptop Subjects.jmp data tables.
3. Select Analyze > Consumer Research > Choice.
Note: This can be done from any of the three open data tables.
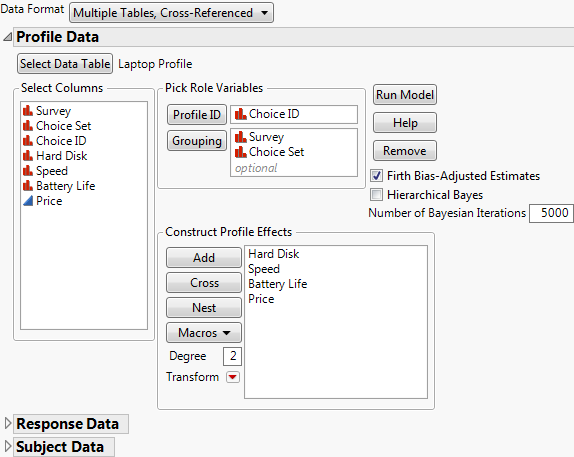
4. From the Data Format list, select Multiple Tables, Cross-Referenced.
5. Click Select Data Table under Profile Data and select Laptop Profile.jmp. Select Choice ID and click Profile ID.
6. Select Hard Disk, Speed, Battery Life, and Price and click Add.
7. Select Survey and Choice Set and click Grouping.
Figure 4.22 Profile Data Window for Laptop Study
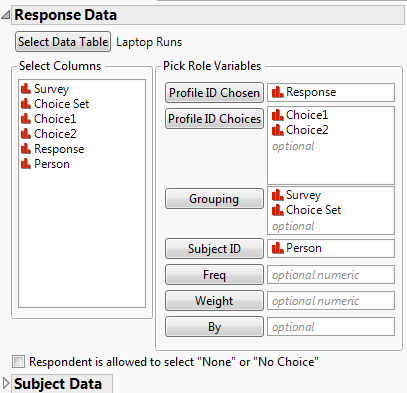
8. Open the Response Data outline.
9. From the Select Data Table list, select Laptop Runs.jmp.
10. Complete the Response Data table as follows:
– Select Response and click Profile ID Chosen.
– Select Choice1 and Choice2 and click Profile ID Choices.
– Select Survey and Choice Set and click Grouping
– Select Person and click Subject ID.
Figure 4.23 Response Data Window for Laptop Study
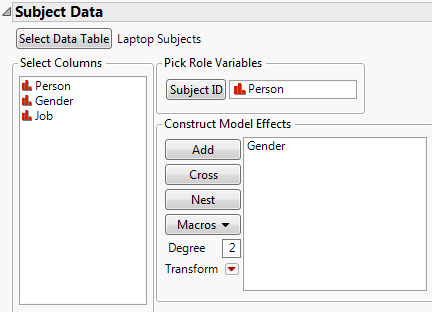
11. Open the Subject Data outline.
12. From the Select Data Table list, select Laptop Subjects.jmp.
13. Select Person and click Subject ID.
14. Select Gender click Add.
Figure 4.24 Subject Data Window for Laptop Study
Analyze the Model
1. Click Run Model.
Figure 4.25 Laptop Effect Summary
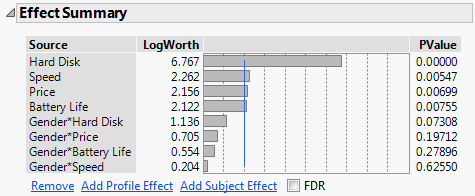
The Effect Summary report shows that Hard Disk is the most significant effect. You can reduce the model by removing terms with a p-value greater than 0.15. This process should be done one term at a time. Here, Gender*Speed is the least significant effect, with a p-value of 0.625.
2. In the Effect Summary report, select Gender*Speed and click Remove.
Figure 4.26 Laptop Results
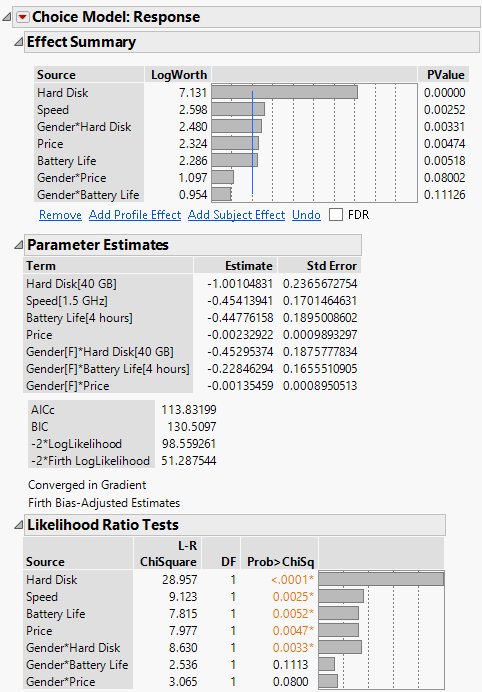
Once Gender*Speed is removed from the model, all effects have a p-value of 0.15 or less. Therefore, you use this as your final model.
3. Click the Choice Model: Response red triangle and select Utility Profiler.
Figure 4.27 Laptop Profiler Results for Females
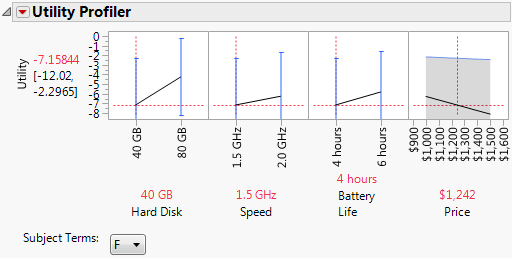
Tip: If your utility profiler does not look like Figure 4.27, click the Utility Profiler red triangle and select Appearance > Adapt Y Axis.
4. From the list next to Subject Terms, select M.
Figure 4.28 Laptop Profiler Results for Males in Development
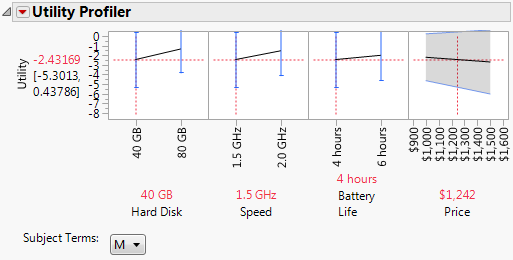
The interaction effect between Gender and Hard Disk is highly significant, with a p-value of 0.0033 (Figure 4.26). In the Utility Profilers, check the slope for Hard Disk for both levels of Gender. You see that the slope is steeper for females than for males.
Comparisons to Baseline
Suppose you are developing a new product. You want to explore the likelihood that a customer selects the new product over the old product, or over a competitor’s product. Use the Probability Profiler to compare profiles to a baseline profile.
In this example, your company is currently producing laptops with 40 GB hard drives, 1.5 GHz processors, and 6-hour battery life, that cost $1,000. You are looking for a way to make your product more desirable by changing as few factors as possible. You set the current product configuration as the baseline. JMP adjusts the probabilities so that the probability of preference for the baseline configuration is 0.5. Then you compare the probabilities of other configurations to the baseline probability.
1. Do one of the following:
– Follow the steps in Complete the Launch Window. Then complete step 1 and step 2 in Analyze the Model.
– In the Laptop Runs.jmp sample data table, click the green triangle next to the Choice Reduced Model script.
2. Click the Choice Model: Response red triangle and select Probability Profiler.
Note that the Probability Profiler is for Gender = F. You can change this later.
3. Using the menus and text box below the profiler, in the Baseline area, specify the Baseline settings as 40 GB, 1.5 GHz, 6 hours, and 1000.
4. Now set these as the values in the Probability Profiler. To set the Price at $1000, click $1242 above Price under the rightmost profiler cell, and type 1000. Then click outside the text box.
Figure 4.29 Probability Profiler with Text Entry Area for Price
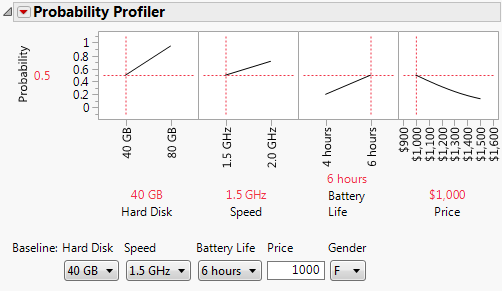
This configuration has probability 0.5.
5. In the Probability Profiler, move the slider for HardDisk to 80 GB.
Notice that, with this change, the probability is relatively insensitive to increases in Price.
6. Click the $1000 label above the Price cell in the profiler, type $1,200, and click outside the text box.
Figure 4.30 Laptop Probability Profiler Results with Baseline Effects
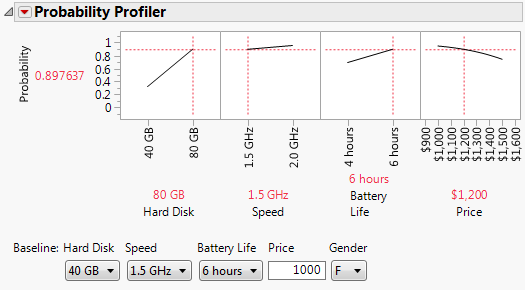
An increase in Hard Disk size from 40 GB to 80 GB and an increase in price to $1200 coincides with an increased probability of preference, from 0.50 to 0.90 for females. Change the Gender effect in the Baseline to M. The probability of preference is 0.71.
Multiple Choice Comparisons
Use the Multiple Choice Profiler to compare product profiles.
• You currently produce a low-end laptop with a small hard drive, a slow processor, and low battery life. You charge $1000.
• Company A produces a product with a fast processor speed and high battery life at a reasonable price of $1200.
• Company B makes the biggest hard drives with the fastest speed, but at a high price of $1500 and low battery life.
You want to gain market share by increasing only one area of performance, and price.
1. Do one of the following:
– Follow the steps in Complete the Launch Window. Then complete step 1 and step 2 in Analyze the Model.
– In the Laptop Runs.jmp sample data table, click the green triangle next to the Choice Reduced Model script.
2. Click the Choice Model: Response red triangle and select Multiple Choice Profiler.
A window appears, asking for the number of alternative choices to profile. Accept the default number of 3.
3. Click OK.
Three Alternative profilers appear. Notice that the profilers are set for Gender = F.
Each factor in each profiler is set to its default values. Alternative 1 indicates the product that you want to develop. Alternative 2 indicates Company A’s product. Alternative 3 indicates Company B’s product.
4. For Alternative 1, set Hard Disk to 40 GB, Speed to 1.5 GHz, Battery Life to 4hours, and Price to $1,000.
5. For Alternative 2, set Hard Disk to 40 GB, Speed to 2.0 GHz, Battery Life to 6 hours, and Price to $1,200.
6. For Alternative 3, set Hard Disk to 80 GB, Speed to 2.0 GHz, Battery Life to 4 hours, and Price to $1,500.
Figure 4.31 Multiple Choice Profiler for Females
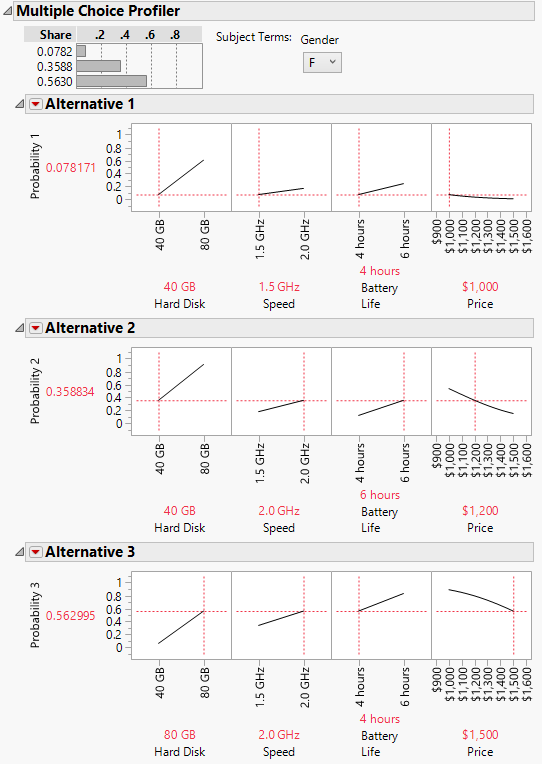
You can see that Company B has the greatest Share of 0.5630. It is obvious that with your company’s settings, very few females buy your product.
You want to increase your market share by upgrading your company’s laptop in one of the performance areas while increasing price. The slope of the line in Alternative 1’s Hard Disk profile suggests increasing hard disk space increases market share the most.
7. For Alternative 1, set Hard Disk to 80 GB and Price to $1,200.
Figure 4.32 Multiple Choice Profiler with Improved Laptop
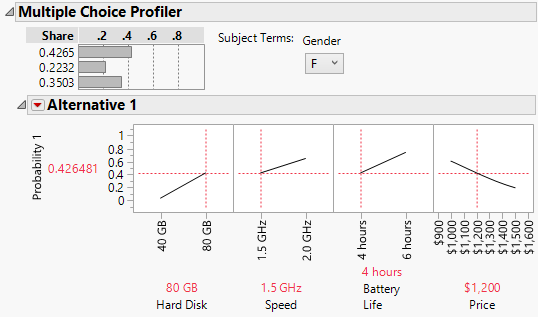
By increasing hard disk space, you can increase the price of your laptop and expect a market share among females of about 43%. This share exceeds that of Company B’s high-performance laptop and is much better than the market share with the initial low-end settings seen in Figure 4.31.
Explore the settings that increase your market share for males. If you increase both Hard Disk size and Speed, you can capture a 44% market share among males.