Example of Robust Fit
1. Select Help > Sample Data Library and open Drosophila Aging.jmp.
2. Select Analyze > Screening > Response Screening.
3. Select all of the continuous columns and click Y, Response.
4. Select line and click X.
5. Check Robust.
6. Click OK.
The Robust FDR PValue Plot is shown in Figure 21.16. Note that a number of tests are significant using the unadjusted robust p-values, as indicated by the red points that are less than 0.05. However, only two tests are significant according to the robust FDR p-values.
Figure 21.16 Robust FDR PValue Plot for Drosophila Data
These two points are more easily identified in a plot that shows FDR LogWorths.
7. Click the Robust FDR LogWorth by Effect Size disclosure icon.
8. Drag a rectangle around the two points with Robust FDR LogWorth values that exceed 1.5.
9. In the PValues data table, select Rows > Label/Unlabel.
Points above the red line at 2 have significance levels below 0.01. A horizontal line at about 1.3 corresponds to a 0.05 significance level.
Figure 21.17 Robust LogWorth by Effect Size for Drosophila Data
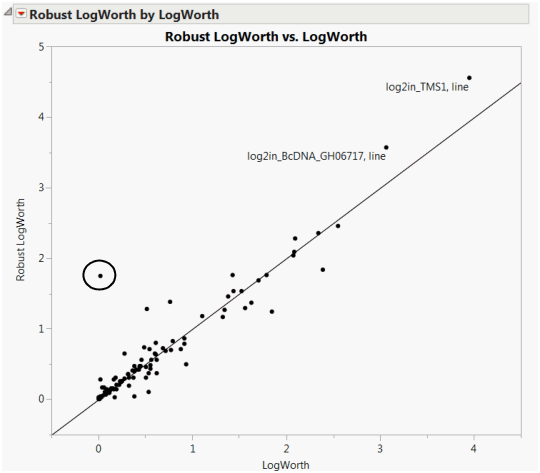
10. Click the Robust LogWorth by LogWorth disclosure icon.
The plot shown in Figure 21.18. If the robust test for a response were identical to the usual test, its corresponding point would fall on the diagonal line in Figure 21.18. The circled point in the plot does not fall near the line, because it has a Robust LogWorth value that exceeds its LogWorth value.
Figure 21.18 Robust LogWorth by LogWorth for Drosophila Data
11. Drag a rectangle around this point in the plot.
12. Find the row for this point in the PValues data table.
Note that the response, log2in_CG8237 has PValue 0.9568 and Robust PValue 0.0176.
13. Click the Response Screening red triangle and select Fit Selected Items.
A Fit Selected Items report is displayed containing a Oneway Analysis for the response log2in_CG8237. The plot shows two outliers for the ORE line (Figure 21.19). These outliers indicate why the robust test and the usual test give disparate results. The outliers inflate the error variance for the non-robust test, which makes it more difficult to see a significant effect. In contrast, the robust fit down-weights these outliers, thereby reducing their contribution to the error variance.
Figure 21.19 Oneway Analysis for log2in_CG8237