Example of the Cumulative Damage Platform
A step-stress experiment is conducted on 40 test units at varying stress conditions. Your goal is to estimate the probability of failure at 10,000 time units given a stress level of 0.75. These data tables are based on data from Nelson (2004, ch. 10).
The Reliability/CD Step Stress Pattern.jmp data table contains a column called Pattern ID that identifies four different stress patterns. The stress level at a particular step is the ratio of Voltage to Thickness. (Note that these two columns are hidden.) Thickness is held constant for each stress pattern. However, Voltage is set to different levels and increases within each pattern.
The Reliability/CD Step Stress.jmp data table contains the time to failure data.
1. Select Help > Sample Data Library and open Reliability/CD Step Stress.jmp and Reliability/CD Step Stress Pattern.jmp.
The CD Step Stress table contains failure time data:
– The Time column gives the failure times.
– The Pattern ID column identifies the stress pattern.
– The Censor column indicates whether the failure time is exact or censored.
Each row of the table corresponds to one test unit.
The CD Step Stress Pattern table contains the four stress patterns (identified as 1 through 4). The levels of the stress factor, Stress, are varied within each value of the Pattern ID column. The Duration column represents how many time units a particular level of the stress factor lasted.
2. Select Analyze > Reliability and Survival > Cumulative Damage.
The launch window has two sections: one for the failure time data (Time-to-Event) and one for the stress pattern data (Stress Pattern).
3. Click Select Table in the Time-to-Event panel.
A Time-to-Event Data Table window appears, which prompts you to specify the data table for the failure time data.
4. Select CD Step Stress and click OK.
The columns from this table now populate the Select Columns list in the Time-to-Event panel.
5. Select Time and click Time to Event.
6. Select Censor and click Censor.
7. Select Pattern ID for Pattern ID.
8. Click Select Table in the Stress Pattern panel.
9. Select CD Step Stress Pattern and click OK.
The columns from this table now populate the Select Columns list in the Stress Pattern panel.
10. Select Duration and click Stress Duration.
11. Select Stress and click Stress.
12. Select Pattern ID and click Pattern ID.
13. Click OK.
Figure 5.2 Event Plot and Stress Patterns Plot
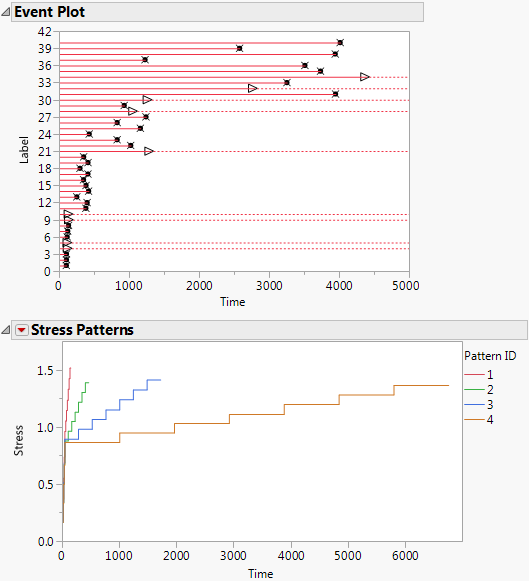
The initial report contains the Event Plot and a plot of the defined stress patterns. All four stress patterns increase the stress level quickly over the first 40 time units, after which they increase at much different rates.
14. Click the Cumulative Damage red triangle and select Fit All.
Figure 5.3 Model List Report
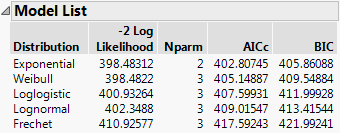
From the Model List report, you determine that the best fitting distribution is the Exponential distribution.
15. In the Results report, scroll to the Exponential report.
16. In the Distribution Profiler report, set the current value of Stress to 0.75.
17. Set the current value of Time to 10000.
Figure 5.4 Distribution Profiler for Exponential Distribution at Specified Settings
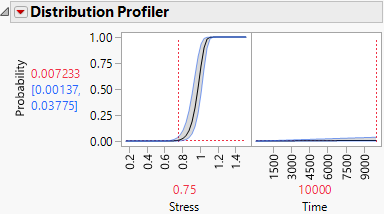
Figure 5.4 shows that the predicted probability of failure for a test unit under constant stress of 0.75 at 10000 time units is 0.007233, with a 95% confidence interval of 0.00137 to 0.03775.