Example of the Partition Platform
In this example, you use the Partition platform to construct a decision tree that predicts the one-year disease progression (low or high) of patients with diabetes.
1. Select Help > Sample Data Library and Diabetes.jmp.
2. Select Analyze > Predictive Modeling > Partition.
3. Select Y Binary and click Y, Response.
4. Select Age through Glucose and click X, Factor.
5. Enter 0.33 for the Validation Portion.
Note: In JMP Pro, a validation column can be used for validation. Select Validation and click Validation. Set the Validation Portion to 0.
6. Click OK.
7. On the platform report window, click Go to perform automatic splitting.
Note: Because you are using a random Validation Portion, your results differ from those in Figure 4.2.
Figure 4.2 Partition Report for Diabetes
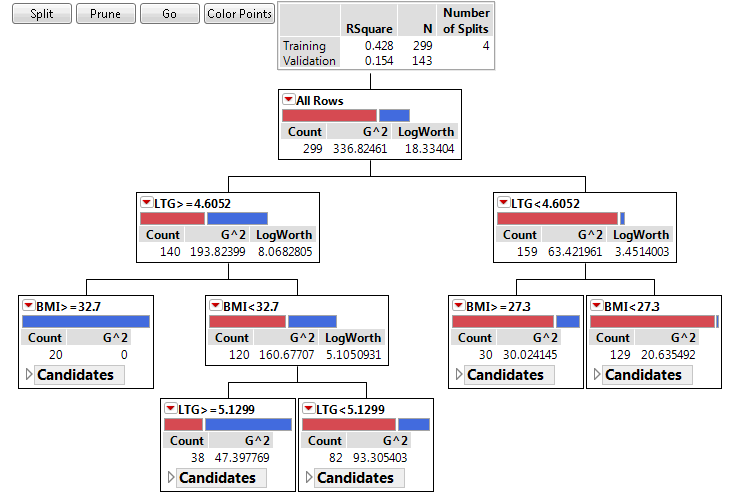
Automatic splitting resulted in four splits. The final RSquare for the Validation set is 0.154. The decision tree shows the four splits and the counts of observations in each split.
8. Click the red triangle next to Partition for Y Binary and select Column Contributions.
Figure 4.3 Column Contributions Report

The Column Contributions report shows that LTG and BMI are the only predictors in the decision tree model. Each column is used in two splits. Your results can differ. When the Validation Portion is used, the validation set is selected at random from the data table. If you redo your analysis, a new random validation set is selected and your results can differ from your first run.
9. Click the red triangle next to Partition for Y Binary and select Save Columns > Profiler.
Figure 4.4 Profiler for Partition Model
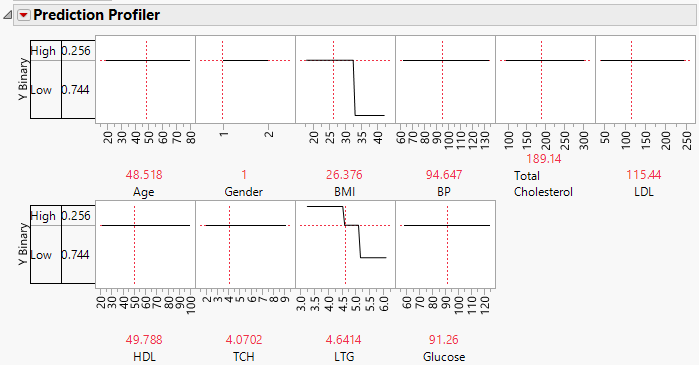
The profiler enables you to change the values of BMI and LTG to obtain the predicted Y Binary outcome. No other factors had a split in the partition model. Their profiles are flat lines.
10. Click the red triangle next to Partition for Y Binary and select Save Columns > Save Prediction Formula.
In the Diabetes.jmp data table, columns called Prob(Y Binary==Low), Prob(Y Binary==High), and Most Likely Y Binary are added. To see how these response probabilities are calculated, in the Columns panel, next to each column, double-click the Formula icon ![]() .
.