Example of the Relative Risk Option
This example uses the Car Poll.jmp sample data table. Examine the relative probabilities of being married and single for the participants in the poll.
1. Select Help > Sample Data Library and open Car Poll.jmp.
2. Select Analyze > Fit Y by X.
3. Select marital status and click Y, Response.
4. Select sex and click X, Factor.
5. Click OK.
6. Click the red triangle next to Contingency Analysis of marital status By sex and select Relative Risk.
The Choose Relative Risk Categories window appears.
Figure 7.15 The Choose Relative Risk Categories Window
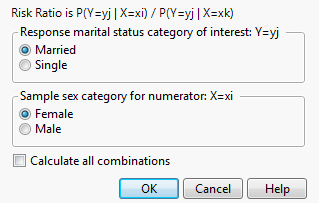
Note the following about the Choose Relative Risk Categories window:
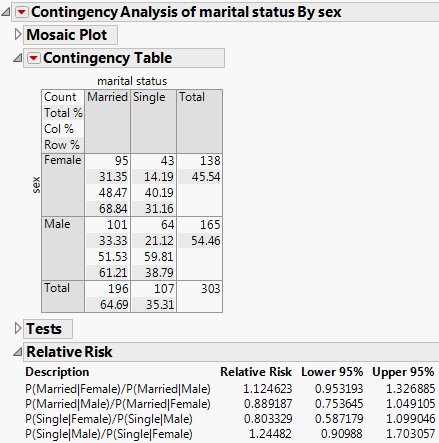
• If you are interested in only a single response and factor combination, you can select that here. For example, if you clicked OK in the window in Figure 7.15, the calculation would be as follows:
• If you would like to calculate the risk ratios for all (2 × 2 = 4) combinations of response and factor levels, select the Calculate All Combinations check box (Figure 7.16).
7. Ask for all combinations by selecting the Calculate All Combinations check box. Leave all other default selections as is.
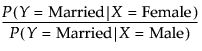
Figure 7.16 Example of the Risk Ratio Report
To see how the relative risk is calculated, proceed as follows:
1. Examine the first entry in the Relative Risk report, which is P(Married|Female)/P(Married|Male).
2. You can find these probabilities in the Contingency Table. Since the probabilities are computed based on two levels of sex, which differs across the rows of the table, use the Row% to read the probabilities, as follows:
P(Married|Female) = 0.6884
P(Married|Male) = 0.6121
Therefore, the calculations are as follows:
P(Married|Female)/P(Married|Male) =  = 1.1247