Publication date: 04/28/2021
Example of Viewing Modeling Type Results
Different modeling types produce different results in JMP. To see an example of the differences, follow these steps:
1. Select Help > Sample Data Library and open Linnerud.jmp.
2. Select Analyze > Distribution.
3. Select Age and Weight and click Y, Columns.
4. Click OK.
Figure 5.4 Distribution Results for Age and Weight
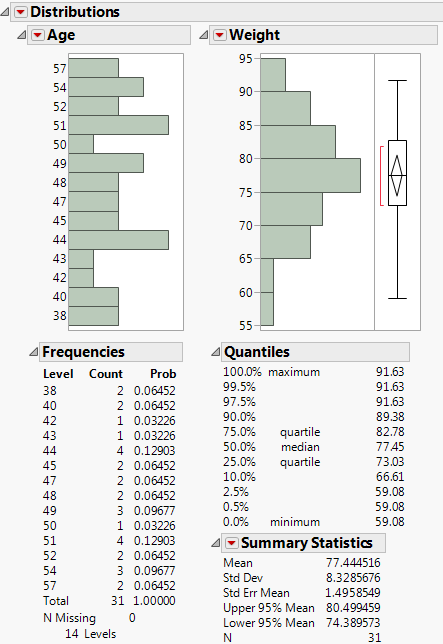
Although Age and Weight are both numeric variables, they are not treated the same. Table 5.2 compares the differences between the results for weight and age.
Variable | Modeling Type | Results |
|---|---|---|
Weight | Continuous | Histogram, Quantiles, and Summary Statistics |
Age | Ordinal | Bar chart and Frequencies |
Want more information? Have questions? Get answers in the JMP User Community (community.jmp.com).