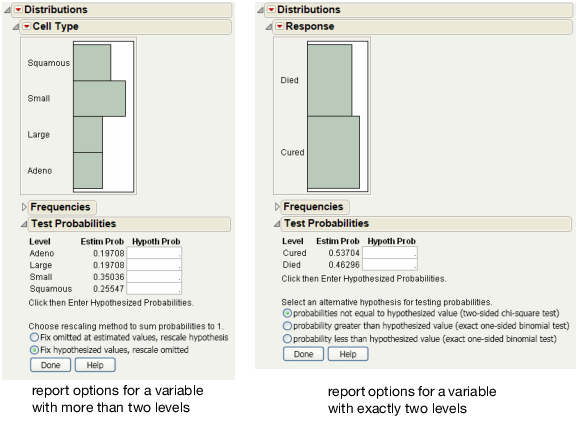
Examples of the Test Probabilities Option
Initiate a test probability report for a variable with more than two levels:
1. Select Help > Sample Data Library and open VA Lung Cancer.jmp.
2. Select Analyze > Distribution.
3. Select Cell Type and click Y, Columns.
4. Click OK.
5. Click the Cell Type red triangle and select Test Probabilities.
See Figure 3.15 at left.
Initiate a test probability report for a variable with exactly two levels:
1. Select Help > Sample Data Library and open Penicillin.jmp.
2. Select Analyze > Distribution.
3. Select Response and click Y, Columns.
4. Click OK.
5. Click the Response red triangle and select Test Probabilities.
See Figure 3.15 at right.
Figure 3.15 Examples of Test Probabilities Options
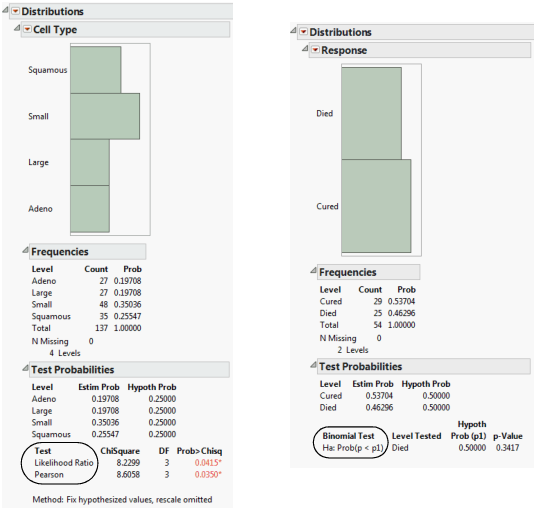
Example of Generating the Test Probabilities Report
To generate a test probabilities report for a variable with more than two levels:
1. Refer to Figure 3.15 at left. Type 0.25 in all four Hypoth Prob fields.
2. Click the Fix hypothesized values, rescale omitted button.
3. Click Done.
Likelihood Ratio and Pearson Chi-square tests are calculated. See Figure 3.16 at left.
To generate a test probabilities report for a variable with exactly two levels:
1. Refer to Figure 3.15 at right. Type 0.5 in both Hypoth Prob fields.
2. Click the probability less than hypothesized value button.
3. Click Done.
Exact probabilities are calculated for the binomial test. See Figure 3.16 at right.
Figure 3.16 Examples of Test Probabilities Reports