Explore Optimal Settings
1. Click the Prediction Profiler red triangle and select Optimization and Desirability > Maximize Desirability.
Figure 11.8 Prediction Profiler for Bounce Data.jmp with Desirability Maximized
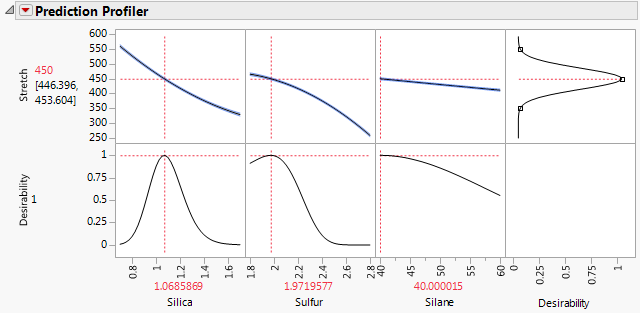
Note: Your optimal settings might differ. This is because there are many points for which the predicted Stretch is 450.
When you specified the response, the goal was set to match a target of 450, with lower and upper limits of 350 and 550. This goal was carried over to the design table and these limits were put in a Response Limits column property for Stretch. A desirability function is constructed from these response limits (top right cell in Figure 11.8). See Response Limits in the Column Properties section.
When you maximize the desirability function, JMP identifies one combination of factor level settings (usually out of many possible combinations) that results in a predicted Stretch of 450. Figure 11.8 shows these settings as Silica = 1.069, Sulfur = 1.972, and Silane = 40.000. Next, you use the Contour Profiler to identify other points that maximize the desirability function.
For more information about the Prediction Profiler, see Profiler in Profilers.
2. Click the Response Stretch red triangle and select Factor Profiling > Contour Profiler. Suppose that you want to achieve your target while setting Sulfur to the value 2.0. Also, you want to make sure that the settings that you choose for Silane and Silica maintain predicted Stretch within 5 units of 450.
3. On the vertical axis, click the red triangle next to Sulfur and select Silane.
Figure 11.9 Contour Profiler for Bounce Data.jmp
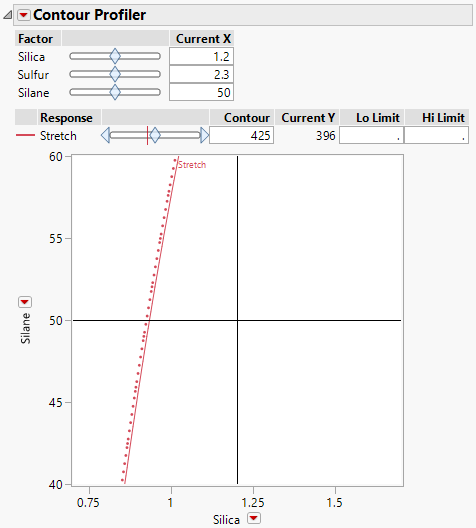
The plot shows the contour of values of Silane and Silica for Stretch at 425 and Sulfur at 2.3.
4. Set the Current X for Sulfur to 2.
5. Set the Contour for Stretch to 450.
6. Set the Lo Limit and Hi Limit for Stretch to 445 and 455, respectively. Press Enter.
Figure 11.10 Contour Profiler Showing Optimal Settings for Silica and Silane
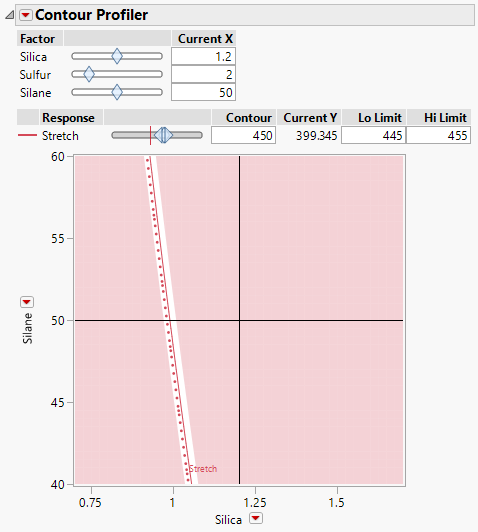
The unshaded band of Silica and Silane values gives predicted Stretch between 445 and 455 when Sulfur is set at 2.0. The values on the solid red curve give predicted Stretch of 450.
7. Drag the crosshairs that appear in the plot to the unshaded band to find settings for Silica and Silane that are best for your process from a practical perspective.
Suppose that your process is known to be more robust at low levels of Silane than at high levels. Then you might consider the settings in Figure 11.11.
Figure 11.11 Contour Profiler Showing Specific Settings for Silica and Silane
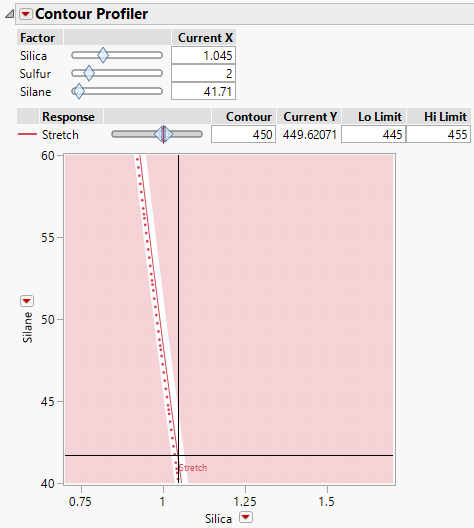
For Sulfur = 2.0, the factor settings identified by the crosshairs are Silica = 1.045 and Silane = 41.71. These settings are shown under Current X. At these settings, the predicted Stretch is 449.62071, shown next to Current Y.
For further information about the Contour Profiler, see Contour Profiler in Profilers.