Publication date: 04/28/2021
Launch the Cell Plot Platform
Launch the Cell Plot platform by selecting Graph > Cell Plot.
Figure 8.3 The Cell Plot Launch Window
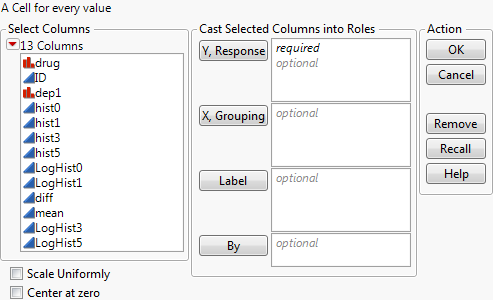
Y, Response
Variables appear on the horizontal axis of the cell plot. Each cell represents a value.
X, Grouping
Produces a separate cell plot for each level of the variable.
Label
Labels each row by the specified variable. See Additional Example of the Cell Plot Platform.
By
Identifies a column that creates a report consisting of separate analyses for each level of the variable.
Scale Uniformly
Represents all variables on the same scale. Without this option, each variable is on a different scale.
Center at zero
Centers the cell plot at zero.
After you click OK, the Cell Plot window appears. See The Cell Plot.
Want more information? Have questions? Get answers in the JMP User Community (community.jmp.com).