Launch Window for Multiple Tables, Cross-Referenced
Launch the MaxDiff platform by selecting Analyze > Consumer Research > MaxDiff. For multiple tables select Multiple Tables, Cross-Referenced form the Data Format menu.
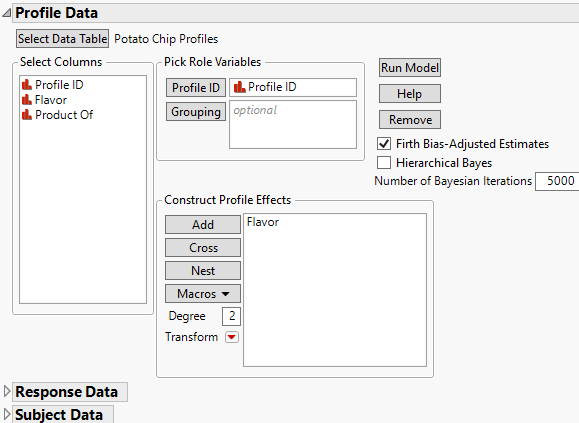
Figure 5.10 Launch Window for Multiple Tables, Cross-Referenced Data Format
For more information about the options in the Select Columns red triangle menu, see Column Filter Menu in Using JMP.
In the case of Multiple Tables, Cross-Referenced, the launch window has three sections:
Profile Data
The profile data table describes the attributes associated with each choice. Each choice can comprise many different attributes, and each attribute is listed as a column in the data table. There is a row for each possible choice, and each possible choice contains a unique ID.
Select Data Table
Select or open the data table that contains the profile data. Select Other to open a file that is not already open.
Profile ID
Identifier for each row of choice combinations. If the Profile ID column does not uniquely identify each row in the profile data table, you need to add Grouping columns. Add Grouping columns until the combination of Grouping and Profile ID columns uniquely identifies the row, or profile.
Grouping
A column which, when used with the Choice Set ID column, uniquely designates each choice set. For example, if Profile ID = 1 for Survey = A, and a different Profile ID = 1 for Survey = B, then Survey would be used as a Grouping column.
Construct Profile Effects
Add effects constructed from the attributes in the profiles.
For information about the Construct Profile Effects panel, see Construct Model Effects in Fitting Linear Models.
Firth Bias-adjusted Estimates
Computes bias-corrected MLEs that produce better estimates and tests than MLEs without bias correction. These estimates also improve separation problems that tend to occur in logistic-type models. See Heinze and Schemper (2002) for a discussion of the separation problem in logistic regression.
 Hierarchical Bayes
Uses a Bayesian approach to estimate subject-specific parameters. See Bayesian Parameter Estimates.
 Number of Bayesian Iterations
(Applicable only if Hierarchical Bayes is selected.) The total number of iterations of the adaptive Bayes algorithm used to estimate subject effects. This number includes a burn-in period of iterations that are discarded. The number of burn-in iterations is equal to half of the Number of Bayesian Iterations specified on the launch window.
Response Data
Figure 5.11 shows the Response Data outline populated using Potato Chip Responses.jmp.
Figure 5.11 Response Data Outline
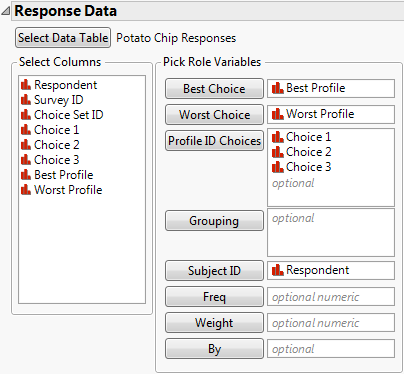
The response data table contains the study results. It gives the choice set IDs for each trial as well as the profiles selected as best and worst by the subject. The Response data are linked to the Profile data through the choice set columns and the choice response column. Grouping variables can be used to align choice indices when more than one group is contained within the data.
Select Data Table
Select or open the data table that contains the response data. Select Other to open a file that is not already open.
Best Choice
The Response table column containing the Profile ID of the profile that the study participant designated as Best.
Worst Choice
The Response table column containing the Profile ID of the profile that the study participant designated as Worst.
Profile ID Choices
The columns that contain the Profile IDs of the set of possible choices for each choice set. There must be at least three profiles.
Grouping
A column which, when used with the Profile ID Chosen column, uniquely designates each choice set.
Subject ID
A unique identifier for the study participant.
Freq
A column containing frequencies. If n is the value of the Freq variable for a given row, then that row is used in computations n times. If it is less than 1 or missing, then JMP does not use it to calculate any analyses.
Weight
A column containing a weight for each observation in the data table. The weight is included in analyses only when its value is greater than zero.
By
Produces a separate report for each level of the By variable. If more than one By variable is assigned, a separate report is produced for each possible combination of By variables.
Subject Data
Figure 5.12 shows the Subject Data outline populated using Potato Chip Subjects.jmp.
Figure 5.12 Subject Data Outline
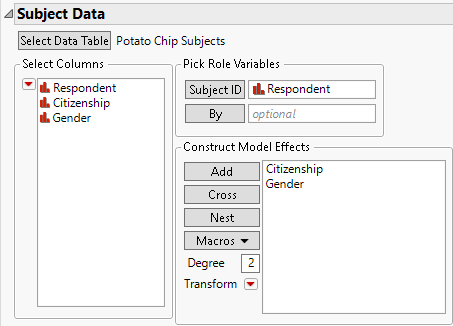
Note: A subject data table is optional, depending on whether subject effects are to be modeled.
The subject data table contains the Subject ID and one or more columns of attributes or characteristics for each subject. The subject data table contains the same number of rows as subjects and has an identifier column that matches a similar column in the Response data table.
Note: You can include subject data in the response data table, but you need to specify subject effects in the Subject Data outline.
Select Data Table
Select or open the data table that contains the subject data. Select Other to open a file that is not already open.
Subject ID
Unique identifier for the subject.
By
Produces a separate report for each level of the By variable. If more than one By variable is assigned, a separate report is produced for each possible combination of By variables.
Construct Model Effects
Add effects constructed from columns in the subject data table.
For information about the Construct Model Effects panel, see Construct Model Effects in Fitting Linear Models.