Make Table
Clicking Make Table creates a data table that contains the runs for your experiment. The example in Figure 12.11 shows a full factorial design with five center points for three factors: X1 (a two-level continuous factor), X2 (a three-level continuous factor), and X3 (a two-level categorical factor). The design uses the default values for the factor levels. The center points are in rows 7, 8, 12, 14, and 17. See Pattern Column.
Figure 12.11 Design Data Table
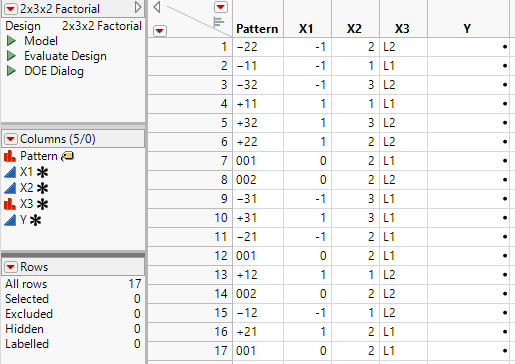
The name of the table, shown in the upper left corner, is the design type that generated it.
Design Table Scripts
The design table includes the following scripts:
Model
Runs the Analyze > Fit Model platform.
Evaluate Design
Runs the DOE > Design Diagnostics > Evaluate Design platform.
DOE Dialog
Re-creates the Full Factorial Design window that you used to generate the design table. The script also contains the random seed used to generate your design.
Run the Screening or Model scripts to analyze the data.
Pattern Column
The Pattern column contains entries that summarize the run in the given row. You can use Pattern as a label variable in plots.
• For a two-level continuous factor, the low setting is denoted by “–”, the high setting by “+”, and a center point by “0”.
• For a continuous factor with more than two levels:
– For a non-center point, the factor setting is denoted by an integer that corresponds to the value level for the run.
– For a center point, the factor setting is denoted by a “0”.
• For a categorical factor, the factor setting is denoted by an integer that corresponds to the value level for the run.