 Model Summary
The Model Summary report describes the model that you have fit and provides summary information about the fit itself.
 Model Description Detail
The first part of the Model Summary report gives information that describes the model that you have fit.
Response
The column assigned to the Y role in the Fit Model window. When two columns are used to specify interval censoring, both column names are listed.
Distribution
The Distribution selected in the Fit Model window. For Quantile Regression, the value of the specified quantile for the response is also displayed.
Estimation Method
The Estimation Method selected in the Model Launch panel.
Validation Method
The Validation Method selected in the Model Launch panel.
Mean Model Link
The link function for the model for the mean, based on the Distribution selected in the Fit Model window.
Location Model Link
The link function for the model for the location parameter, shown when Cauchy is selected as the Distribution in the Fit Model window.
Scale Model Link
The link function for the model for the scale parameter, based on the Distribution selected in the Fit Model window.
Probability Model Link
The link function for the model for the probability, based on the Distribution selected in the Fit Model window.
Dispersion Model Link
The link function for the model for the dispersion parameter, based on the Distribution selected in the Fit Model window.
Zero Inflation Model Link
The link function for the model for the zero inflation parameter, based on the Distribution selected in the Fit Model window.
 Model Fit Detail
The second part of the Model Summary report gives statistics related to the model fit. If either Holdback or Validation Column is selected as the Validation Method, these statistics are computed separately for the training and validation sets. This part of the Model Summary report is not available if either KFold or Leave-One-Out is selected as the Validation Method.
Number of rows
The number of rows.
Sum of Frequencies
The sum of the values of a column assigned to the Freq or Weight role in the Fit Model window.
Note: For -LogLikelihood, BIC, AICc, and ERIC, smaller is better. See Likelihood, AICc, and BIC in the Statistical Details section.
-LogLikelihood
The negative of the natural logarithm of the likelihood function for the current model.
Note: -LogLikelihood is not available for Quantile Regression.
Objective Function
(Available only for Quantile Regression.) The value of the function that is minimized to fit the specified quantile regression model. The function that is minimized is the check-loss function.
Number of Parameters
The number of nonzero parameters in the current model.
BIC
The Bayesian Information Criterion:  .
.
AICc
The corrected Akaike Information Criterion:  .
.
ERIC
(Available only for exponential family distributions and when the Lasso or adaptive Lasso estimation method is specified.) The Extended Regularization Information Criterion:  where λ is the value of the tuning parameter and φ is the nuisance parameter. See Hui et al. (2015).
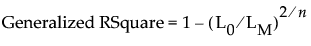
Generalized RSquare
(Not available for Quantile Regression.) An extension of the RSquare measure that can be applied to general regression models. Generalized RSquare compares the likelihood of the fitted model (LM) to the likelihood of the intercept-only (constant) model (L0). It is scaled to have a maximum of 1. For distributions other than Binomial, the Generalized RSquare is defined as follows:
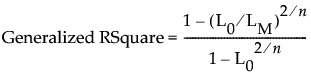
When Binomial is the specified distribution, the Generalized RSquare is defined as follows:
A Generalized RSquare value of 1 indicates a perfect model; a value of 0 indicates a model that is no better than a constant model. The Generalized RSquare measure simplifies to the traditional RSquare for continuous normal responses in the standard least squares setting. Generalized RSquare is also known as the Nagelkerke or Craig and Uhler R2, which is a normalized version of Cox and Snell’s pseudo R2. See Nagelkerke (1991).
Note: Generalized RSquare is replaced by RSquare when the Normal distribution is specified.
Caution: You should not compare Generalized RSquare values for models that use different response distributions. The comparison being made is to the intercept-only model with a given response distribution.
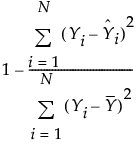
RSquare
(Available only when the Normal distribution is specified.) Estimates the proportion of variation in the response that can be attributed to the model rather than to random error. An RSquare value of 1 indicates a perfect model; a value of 0 indicates a model that is no better than a constant model. The RSquare value is calculated as follows:
RSquare Adj
(Available only when the Normal distribution is specified and the estimation method does not involve a penalty.) Adjusts the RSquare statistic for the number of parameters in the model. Rsquare Adj facilitates comparisons among models with different numbers of parameters. The computation uses the degrees of freedom. The RSquare Adj value is calculated as follows:
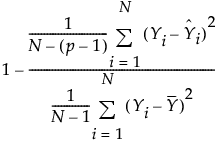
where N is the number of observations and p is the number of parameters.
Note: When there is a Validation set, the adjusted RSquare statistic is reported only for the Training set.
RMSE
(Available only when the Normal distribution is specified.) The Root Mean Square Error (RMSE) estimates the standard deviation of the random error. This quantity is the square root of the mean of the sum of squared errors in the current model.
Lambda Penalty
(Available only for the Dantzig Selector, Lasso, Elastic Net, Ridge, and Double Lasso estimation methods.) The value of the tuning parameter λ for the current model. See Statistical Details for Estimation Methods.