One-Sided CUSUM Chart Example
Consider the data used in V-Mask CUSUM Chart Example, where the machine fills 8-ounce cans of engine oil. In order to cut costs, the manufacturer is now concerned about significant over-filling (and not so concerned about under-filling). Use a one-sided CUSUM chart to identify any instances of over-filling. Anything that is 0.25 ounces beyond the mean of 8.1 is considered a problem.
1. Select Help > Sample Data Library and open Quality Control/Oil1 Cusum.jmp.
2. Select Analyze > Quality And Process > Legacy Control Charts > CUSUM.
3. Deselect Two Sided.
4. Select weight and click Process.
5. Select hour and click Sample Label.
6. Click H and type 0.25.
7. Click Specify Stats.
8. Type 8.1 next to Target.
8.1 is the average weight in ounces of a filled can. This is the target mean.
9. Type 1 next to Delta.
1 is the absolute value of the smallest shift to be detected as a multiple of the process standard deviation or of the standard error.
10. Type 0.05 next to Sigma.
0.05 is the known standard deviation of fill weights (σ0) in ounces.
11. Click OK.
Figure 12.29 One-Sided CUSUM Chart for Oil1 Cusum.jmp Data
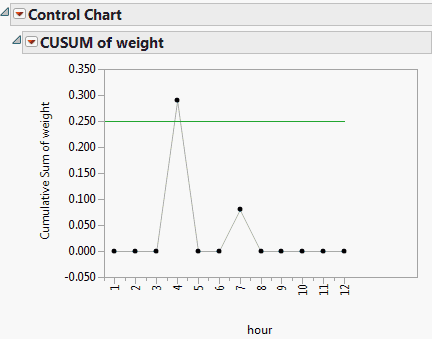
The decision interval is set at the H value that you entered (0.25). You can see that at the fourth hour, some significant over-filling occurred.