Process Information
The launch window displays a list of columns in the current data table. Here, you specify the variables to be analyzed and the subgroup sample size.
Process
The Process role selects variables for charting:
• For variables charts, specify measurements as the process.
• For attribute charts, specify the defect count or defective proportion as the process. The data are interpreted as counts, unless it contains non-integer values between 0 and 1.
Note: The rows of the table must be sorted in the order in which you want them to appear in the control chart. Even if there is a Sample Label variable specified, you still must sort the data accordingly.
Sample Label
The Sample Label role enables you to specify a variable whose values label the horizontal axis and can also identify unequal subgroup sizes. If you do not specify a sample label variable, the samples are identified by their subgroup sample number.
• If the sample subgroups are the same size, select the Sample Size Constant option and enter the size in the text box. If you entered a Sample Label variable, its values are used to label the horizontal axis. The sample size is used in the calculation of the limits regardless of whether the samples have missing values.
• If the sample subgroups have an unequal number of rows or have missing values and you have a column identifying each sample, select the Sample Grouped by Sample Label option and enter the sample identifying column as the sample label.
For attribute charts (P, NP, C, and U charts), this variable is the subgroup sample size. Additional options appear on the launch window, including Sample Size, Constant Size, or Unit Size, depending on your selection. In variables charts, it identifies the sample. When the chart type is IR, a Range Span text box appears. The range span specifies the number of consecutive measurements from which the moving ranges are computed.
Notes:
• The rows of the table must be sorted in the order in which you want them to appear in the control chart. Even if there is a Sample Label variable specified, you still must sort the data accordingly.
• The non-integer part of the value for Constant Size is truncated. If you have a constant non-integer subgroup sample size, you must specify a column of constant values.
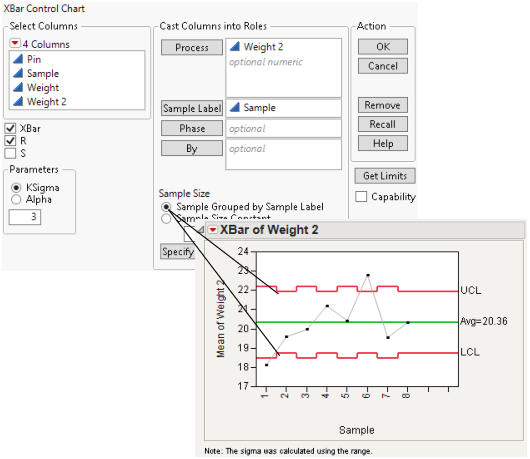
The illustration in Figure 12.4 shows an XBar chart for a process with unequal subgroup sample sizes, using the Coating.jmp sample data from the Quality Control sample data folder.
Figure 12.4 Variables Charts with Unequal Subgroup Sample Sizes
Phase
The Phase role enables you to specify a column identifying different phases, or sections. A phase is a group of consecutive observations in the data table. For example, phases might correspond to time periods during which a new process is brought into production and then put through successive changes. Phases generate, for each level of the specified Phase variable, a new sigma, set of limits, zones, and resulting tests.
On the window for XBar, R, S, IR, P, NP, C, U, Presummarize, and Levey-Jennings charts, a Phase variable button appears. If a phase variable is specified, the phase variable is examined, row by row, to identify to which phase each row belongs. Saving to a limits file reveals the sigma and specific limits calculated for each phase. See Phase Example for an example.
By
The By role identifies a variable to produce a separate analysis for each value that appears in the column.