Profiling the Fitted Model
Use the Profiler, Contour Profiler, or Surface Profiler to gain further insight into the fitted model. To select a profiler option, click the Loglinear Variance Fit red triangle and select one of the options under the Profilers menu.
Example of Profiling the Fitted Model
For example, suppose that the goal was to find the factor settings that achieved a target of 35 for the response, but at the smallest variance. Fit the models and choose Profiler from the report menu. For example, Figure 10.7 shows the Profiler set up to match a target value for a mean and to minimize variance.
1. Select Help > Sample Data Library and open InjectionMolding.jmp.
2. Select Analyze > Fit Model.
Since the variables in the data table have been assigned preselected roles, the analysis runs automatically.
3. Click the Loglinear Variance Fit red triangle and select Profilers > Profiler.
4. Click the Prediction Profiler red triangle and select Optimization and Desirability > Set Desirabilities.
5. In the Response Goal window that appears, change Maximize to Match Target.
6. Click OK.
7. In the second Response Goal window, click OK.
8. Click the Prediction Profiler red triangle and select Optimization and Desirability > Maximize Desirability.
9. Click the Prediction Profiler red triangle and select Prediction Intervals.
Figure 10.7 Profiler to Match Target and Minimize Variance with Prediction Intervals
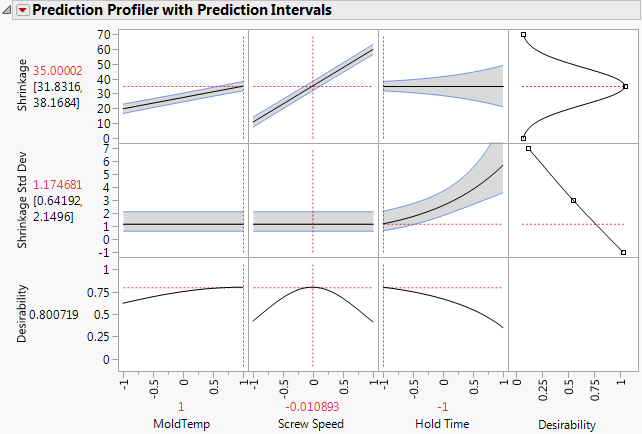
One of the best ways to see the relationship between the mean and the variance (both modeled with the LogVariance personality) is through looking at the individual prediction confidence intervals about the mean. Regular confidence intervals (those shown by default in the Profiler) do not show information about the variance model as well as individual prediction confidence intervals do. Prediction intervals show both the mean and variance model in one graph.
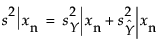
If Y is the modeled response, and you want a prediction interval for a new observation at xn, then:
where:
 is the variance for the individual prediction at xn
 is the variance of the distribution of Y at xn
 is the variance of the sampling distribution of
  , and is also the variance for the mean.
Because the variance of the individual prediction contains the variance of the distribution of Y, the effects of the changing variance for Y can be seen. Not only are the individual prediction intervals wider, but they can change shape with a change in the variance effects.