Report for Continuous Responses
The sample data table Diabetes.jmp was used to create a report for the continuous response Y.
Figure 4.9 Partition Report for a Continuous Response
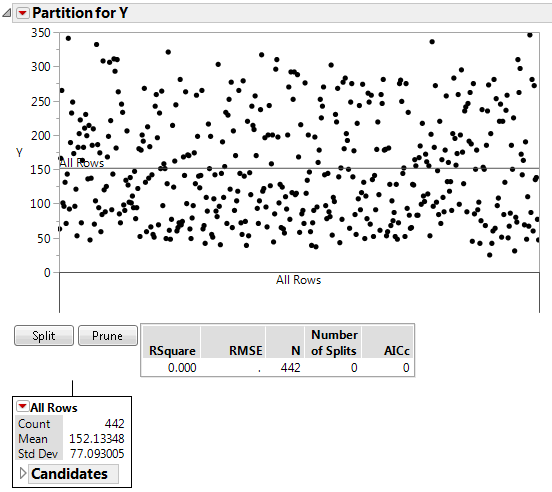
Partition Plot
The partition plot is initialized without any splits. Each point represents an observation in the data table. If validation is used, the plot is only for the training data.
Notice the following:
• The vertical axis represents the response value of the observations.
• Horizontal lines show the mean response value for each node of the decision tree. The initial horizontal line is at the overall mean of the response.
• Vertical axis divisions represent splits in the decision tree. A text description of the most recent split appears below the horizontal axis. Observations are reorganized into their respective nodes as splits are created or removed.
Tip: To see tooltips for narrow partitions, place your cursor over the labels on the horizontal axis of the partition plot.
Summary Report
Figure 4.10 Summary Report for a Continuous Response
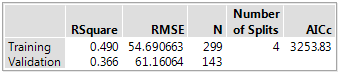
The Summary Report provides fit statistics for the training data and validation and test data (if used). The fit statistics in the Summary Panel update as you add splits or prune the decision tree.
RSquare
The current value of R2.
RMSE
The root mean square error.
N
The number of observations.
Number of Splits
The current number of splits in the decision tree.
AICc
The corrected Akaike’s Information Criterion. See Likelihood, AICc, and BIC in Fitting Linear Models.
Node Reports
Each node in the tree has a report and a red triangle menu with additional options. Terminal nodes also have a Candidates report.
Figure 4.11 Terminal Node Report for a Continuous Response
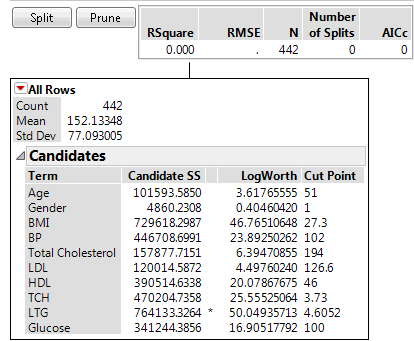
Count
The number of observations (rows) in the branch.
Mean
The average response for all observations in that branch.
Std Dev
The standard deviation of the response for all observations in that branch.
Candidates
For each column, the Candidates report provides details about the optimal split for that column. The optimal split over all columns is marked with an asterisk.
Term
Shows the candidate columns.
Candidate SS
Sum of squares for the best split.
LogWorth
The LogWorth statistic, defined as -log10(p-value). The optimal split is the one that maximizes the LogWorth. See Statistical Details for the Partition Platform.
Cut Point
The value of the predictor that determines the split. For a categorical term, the levels in the left-most split are listed.
The optimum split is noted by an asterisk. However, there are cases where the Candidate SS is higher for one variable, but the Logworth is higher for a different variable. In this case > and < are used to point in the best direction for each variable. The asterisk corresponds to the condition where they agree. See Statistical Details for the Partition Platform.