Statistical Details for Measurement Systems Analysis
For more information about the calculations of the limits used in the Range Chart, see Control Limits for XBar and R Charts in the Control Chart Builder section. For more information about the calculations of the limits used in the Standard Deviation Chart, see Control Limits for XBar and S Charts in the Control Chart Builder section.
Computation of Intraclass Correlation and Probable Error
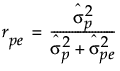
Intraclass Correlation without bias is computed as follows:
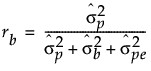
Intraclass Correlation with bias is computed as follows:
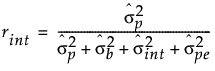
Intraclass Correlation with bias and interaction factors is computed as follows:
Probable Error is computed as follows:

Note the following:
 = variance estimate for pure error
 = variance estimate for product
 = variance estimate for bias factors
 = variance estimate for interaction factors
Z0.75 = the 75% quantile of standard normal distribution