Publication date: 04/28/2021
The Overlay Plot
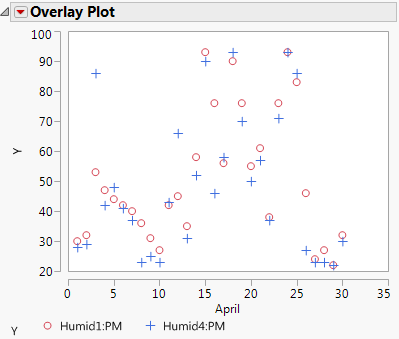
Initially, this platform overlays all specified Y columns. The legend below the plot shows individual markers and colors that identify each Y column. For information about additional options for the plot, see Overlay Plot Options.
Figure A.7 The Overlay Plot
Want more information? Have questions? Get answers in the JMP User Community (community.jmp.com).