Overlay Plot Options
The basic Overlay Plot is shown in Figure A.7.
The Overlay Plot platform has plotting options accessed from the red triangle menu on the Overlay Plot title bar. When you select one of these options at the platform level, it affects all plots in the report if no legend levels are highlighted. If one or more plot legend levels are highlighted, the options affect only those plots. There is also a single-plot options menu for each Y variable, which appears when you highlight a Y variable legend beneath the plot and right-click.
The individual plot options are the same as those in the Y Options submenu at the platform level. See Y Options.
General Overlay Platform Options
When you select one of these options at the platform level, it affects all plots in the report if no legend levels are highlighted. If one or more plot legend levels are highlighted, the options affect only those plots.
Overlay Plots
Contains options for overlaying:
Overlay Y’s
Overlays all variables assigned to the Y role on one plot. This option is on by default and unavailable if only one Y variable is assigned.
Overlay Groups
Overlays groups and produces a legend. This option is off by default and unavailable if no grouping variables are assigned. See Overlay Groups.
No Overlay
Turns off overlaying for both Ys and groups. Creates a separate plot for each Y and each group. This option is off by default unless only one Y variable is assigned and no grouping variables are assigned. In this case, no overlaying options are available.
Separate Axes
Assigns each plot its own set of xy-axes. If Separate Axes is off, the vertical axis is shared across the same row of plots and the horizontal axis is shared on the same column of plots. The default setting is on (except when multiple plots exist). See Separate Axes.
Uniform Y Scale
Uses the same Y scale for all grouped plots. The default setting is off.
Connect Thru Missing
Connects adjacent points in the plot, regardless of missing values. The default setting is off.
Range Plot
Connects the lowest and highest points at each x value with a line with bars at each end. The Needle and Range Plot options are mutually exclusive.
Y Options
Contains options for the Y variables. See Y Options.
Ungroup Plots
Creates a separate chart for each level of a grouping variable.
Arrange Plots
Enables you to specify the number of plots in each row.
See Local Data Filter, Redo Menus, and Save Script Menus in Using JMP for more information about the following options:
Local Data Filter
Shows or hides the local data filter that enables you to filter the data used in a specific report.
Redo
Contains options that enable you to repeat or relaunch the analysis. In platforms that support the feature, the Automatic Recalc option immediately reflects the changes that you make to the data table in the corresponding report window.
Save Script
Contains options that enable you to save a script that reproduces the report to several destinations.
Save By-Group Script
Contains options that enable you to save a script that reproduces the platform report for all levels of a By variable to several destinations. Available only when a By variable is specified in the launch window.
Overlay Groups
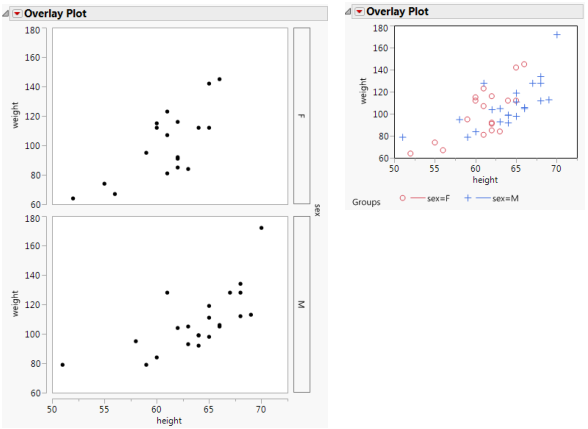
Figure A.8 shows the effect that the Overlay Groups option has on an overlay plot with one Y variable, one X variable, and a grouping variable. The grouping variable has two levels. The plot on the left has Overlay Groups turned off, so a separate graph is produced for the two levels of the grouping variable. The plot on the right has Overlay Groups turned on, so there is a single graph that uses colors and markers to show the two levels of the grouping variable. A legend describing the levels is added under the graph.
Figure A.8 Overlay Groups: Off (left) and On (right)
Separate Axes
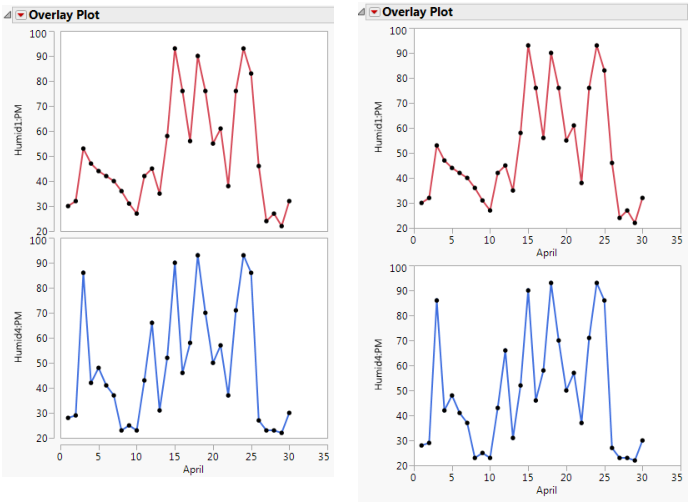
Figure A.9 shows the effect that the Separate Axes option has on an overlay plot with two Y variables and one X variable. The Overlay Y’s option is turned off, so a separate plot is produced for each Y variable. The plot on the left has Separate Axes turned off, so the two graphs share a single x-axis. The plot on the right has Separate Axes turned on, so both graphs have their own x-axis.
Figure A.9 Separate Axes: Off (left) and On (right)
Y Options
Each Y variable is labeled in a legend beneath the plot. The Y options are available from the Y Options menu from the Overlay Plot red triangle menu. You can also access the Y Options menu by right-clicking on any Y variable in the legend.
Note: If no Y variables are selected, any Y options that you select affect all Y variables. If one or more of the Y variables are selected, any Y options that you select affect only those you have selected.
Selecting and Deselecting Y Variables in the Legend
• Hold the Shift key and click to select multiple contiguous legend levels.
• Hold the Ctrl key and click to select multiple discontiguous legend levels.
• Hold the Ctrl key and click a selected legend level to deselect it.
Show Points
A toggle that either shows or hides points in the graph.
Connect Points
A toggle that either connects the points with lines or turns the connecting lines off. You can use Connect Points without showing points.
Needle
Draws a vertical line from each point to the x-axis.
Step
Draws a horizontal line from each point to the x value of the following point, and then a vertical line to that point. You can use Step without showing points.
Note: The Connect Points, Needle, and Step options are mutually exclusive.
Function Plot
Plots a formula (stored in the Y column) as a smooth curve. To use this function, store a formula in a column that is a function of a single X column. Assign the formula to the Y role.
Connect Color
Displays the JMP color palette for assigning colors to connecting lines.
Overlay Marker
Displays the JMP marker palette for assigning markers to plotted points.
Overlay Marker Color
Assigns a color to all points of the selected variable.
Line Style
Enables the choice of dashed, dotted, or other line styles.
Line Width
Enables the choice of line widths.