Analyze the Augmented Design
Suppose you have conducted the additional experimental runs and have recorded results to analyze.
1. Select Help > Sample Data Library and open Design Experiment/Reactor Augment Data.jmp.
You want to maximize Percent Reacted. However, the column’s Response Limits column property in this sample data table is set to Minimize.
2. In the Columns panel of the data table, click the asterisk next to the Percent Reacted column name and select Response Limits, or from the Cols menu select Column Info.
3. In the Column Info dialog that appears, change the response limit goal to Maximize.
Figure 6.5 Change the Response Limits Column Property for the Percent Reacted Column
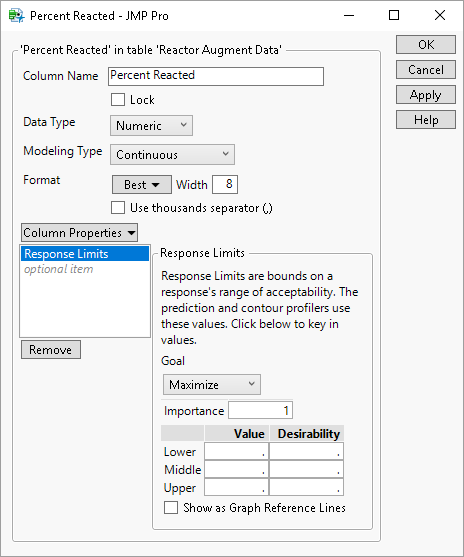
4. Click OK.
You are now ready to run the analysis.
5. In the Table panel of the data table, click the green triangle next to the Model script.
The Model script opens the Fit Model window with all main effects and two-factor interactions as effects.
6. Change the fitting personality from Standard Least Squares to Stepwise and then click Run.
7. In the Stepwise Regression Control panel, select P-value Threshold from the Stopping Rule menu and Mixed from the Direction menu. Enter 0.05 for the Prob to Enter and 0.1 for the Prob to Leave.
8. In the Current Estimates panel, select the Entered check boxes for all the main effect terms (Feed Rate - Concentration) and then click Go.
Figure 6.6 Completed Stepwise Model
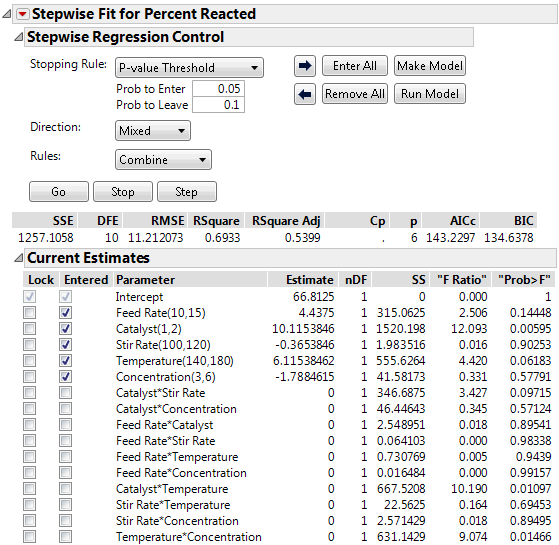
Stepwise regression, beginning with the main effects and using a p-value based search, results in a model with four main effects and three interaction terms. The main effect Feed Rate was removed from the model while the Catalyst*Temperature, Stir Rate*Temperature, and Temperature*Concentration interactions were added to the model.
9. Click Make Model on the Stepwise Regression Control panel.
This launches the Fit Model platform for the model built using the stepwise procedure.
10. Click Run.
Figure 6.7 Prediction Model Analysis of Variance and Lack of Fit Tests
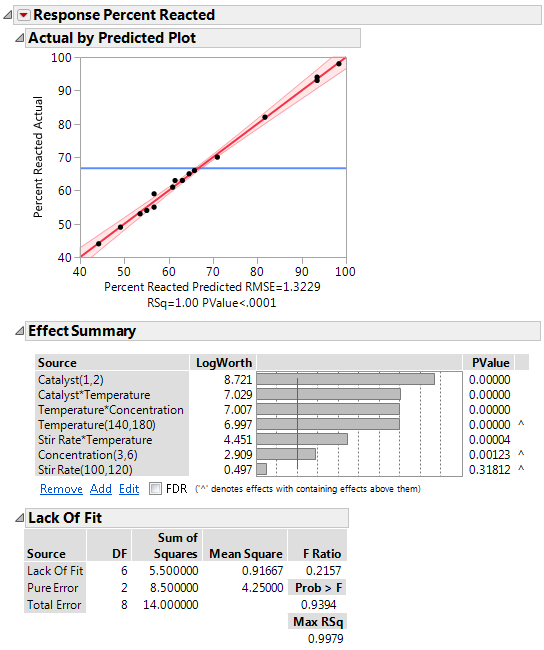
The Actual by Predicted Plot indicates that the overall model is significant (PValue < .0001). Both the Actual by Predicted Plot and the Lack of Fit tests show no evidence of model misspecification. The Effect Summary report shows that Catalyst is the most significant effect. However, note that the three two-factor interactions are also significant.
11. Click the Prediction Profiler red triangle and select Optimization and Desirability > Maximize Desirability.
Figure 6.8 Maximum Percent Reacted
The prediction profile plot shows that the maximum percent reaction occurs at high Catalyst, Stir Rate, and Temperature and low Concentration. At these extreme settings, the estimate of Percent Reacted is 98.38.