Capability Box Plots
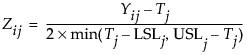
The Capability Box Plots show a box plot for each variable selected in the analysis. The values for each column are centered by their target value and scaled by the difference between the specification limits. If the target is not centered between the specification limits, the values are scaled by twice the minimum difference between the target and specification limits. For each process column Yj (see Notation for Goal Plots and Capability Box Plots for a description of the notation):
For a process with a one-sided specification, see One-Sided or Missing Specification Limits. For the situation where no target is specified, see Capability Box Plots for Processes with Missing Targets.
Note: Process variables with distributions other than Normal are not plotted on the Capability Box Plot.
Figure 7.11 shows a Capability Box Plots report for eight variables in the Semiconductor Capability.jmp sample data table.
Figure 7.12 Capability Box Plot
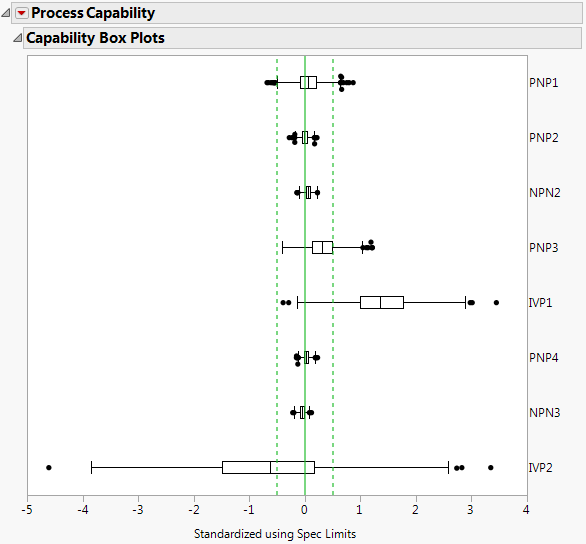
The plot displays dotted green lines drawn at ±0.5.
• For a process with a target that is centered between its specification limits, the dotted green lines represent the standardized specification limits.
• For a process with a target that is not centered between its specification limits, one of the dotted green lines represents the standardized specification limit for the limit closer to the target. The other dotted green line represents the same distance in the opposite direction.
This plot is useful for comparing variables with respect to their specification limits. For example, in Figure 7.12, the majority of points for IVP1 are above its USL, and the majority of its points for IVP2 are less than its target. PNP2 seems to be on target with all data points in the specification limits.
One-Sided or Missing Specification Limits
When there is only one specification limit for a column, colors are used in the following ways:
• If only the upper specification limit (USL) is specified, the box plot is colored blue.
• If only the lower specification limit (LSL) is specified, the box plot is colored red.
• If at least one process has only an upper specification limit, the dotted line at 0.5 is blue.
• If at least one process has only a lower specification limit, the dotted line at -0.5 is red.
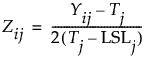
Suppose that only the lower specification limit is specified and that the process target is specified. The capability box plot is based on the following values for the transformed observations. See Notation for Goal Plots and Capability Box Plots for a description of the notation:
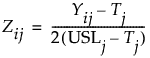
Suppose that only the upper specification limit is specified and that the process target is specified. The capability box plot is based on the following values for the transformed observations:
For more information about how missing targets are handled with one-sided specification limits, see Single Specification Limit and No Target.