Compare a Fractional Factorial Design and a Main Effects Screening Design
In this example, suppose an engineer wants to investigate a process that uses an electron beam welding machine to join two parts. The engineer fits the two parts into a welding fixture that holds them snugly together. A voltage applied to a beam generator creates a stream of electrons that heats the two parts, causing them to fuse. The ideal depth of the fused region is 0.17 inches. The engineer wants to study the welding process to determine the best settings for the beam generator to produce the desired depth in the fused region.
For this study, the engineer wants to explore the following seven factors:
• Operator is the technician operating the welding machine. Two technicians typically operate the machine.
• Speed (in rpm) is the speed at which the part rotates under the beam.
• Current (in amps) is a current that affects the intensity of the beam.
• Mode is the welding method used.
• Wall Size (in mm) is the thickness of the part wall.
• Geometry indicates whether the joint is a single-bevel joint or a double-bevel joint.
• Material is the type of material being welded.
Notice that three of these factors are continuous: Speed, Current, and Wall Size. Four are categorical: Operator, Mode, Geometry, and Material. Each of these categorical factors has two levels.
After each processing run, the engineer cuts the part in half. This reveals an area where the two parts have fused. The length of this fused area, measured in inches, is the depth of penetration of the weld. The depth of penetration is the response for the study.
The goals of the study are the following:
• Find which factors affect the depth of the weld.
• Quantify those effects.
• Find specific factor settings that predict a weld depth of 0.17 inches with a tolerance of ±0.05 inches.
Your experimental budget allows you at most 12 runs. Construct and compare two designs for your experimental situation. The first is a classical fractional factorial design using eight runs. The second is a main effects screening design using 12 runs.
Constructing a Standard Screening Design
In this section, construct a standard screening design for this experimental situation.
Specify the Response
1. Select DOE > Classical > Two Level Screening > Screening Design.
2. In the Responses panel, double-click Y under Response Name and type Depth.
Note that the default Goal is Maximize. Your goal is to find factor settings that enable you to obtain a target depth of 0.17 inches with limits of 0.12 and 0.22.
3. Click the default Goal of Maximize and change it to Match Target.
4. Click under Lower Limit and type 0.12.
5. Click under Upper Limit and type 0.22.
6. Leave the area under Importance blank.
Because there is only one response, that response is given Importance 1 by default.
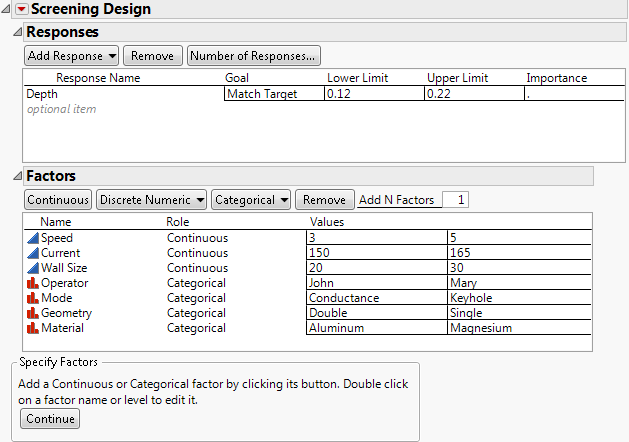
The completed Responses outline appears in Figure 9.2. Now, specify the factors.
Specify Factors
You can enter the factors manually or automatically:
• To enter the factors manually, see Specify Factors Manually.
• To enter the factors automatically, use the Weld Factors.jmp data table:
1. Select Help > Sample Data Library and open Design Experiment/Weld Factors.jmp.
2. Click the Screening Design red triangle and select Load Factors. Proceed to Choose a Design.
Specify Factors Manually
1. Type 3 in the Add N Factors box and click Continuous.
2. Double-click X1 and type Speed.
3. Use the Tab key to move through the rest of the values and factors. Make the following changes:
a. Change the Speed values to 3 and 5.
b. Change X2 to Current, with values of 150 and 165.
c. Change X3 to Wall Size, with values of 20 and 30.
4. Type 4 in the Add N Factors box and select Categorical > 2 Level.
5. Double-click X4 and type Operator.
6. Use the Tab key to move through the rest of the values and factors. Make the following changes:
a. Change the Operator values to John and Mary.
b. Change X5 to Mode, with values of Conductance and Keyhole.
c. Change X6 to Geometry, with values of Double and Single.
d. Change X7 to Material, with values of Aluminum and Magnesium.
Figure 9.2 Responses and Factors Outlines for Weld Experiment
Choose a Design
1. Click Continue.
Because the combination of factors and levels that you have specified can be accommodated by a standard fractional factorial design, the Choose Screening Type panel appears. You can either select a standard design from a list or construct a main effects design.
Note: Setting the Random Seed in the next step reproduces the results shown in this example. When you are constructing a design on your own, this step is not necessary.
2. (Optional) Click the Screening Design red triangle, select Set Random Seed, type 12345, and click OK.
3. Accept the default selection to Choose from a list of fractional factorial designs and click Continue.
4. Select the first Fractional Factorial design.
Figure 9.3 Design List for Three Continuous Factors and Four Categorical Factors
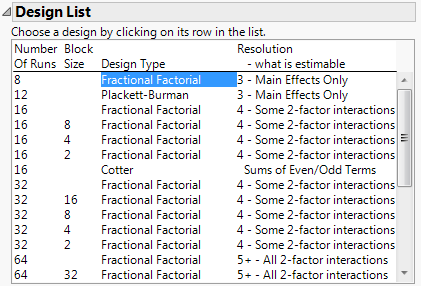
This specifies an eight-run Resolution 3 fractional factorial design. For information about resolution, see Resolution as a Measure of Confounding.
5. Click Continue.
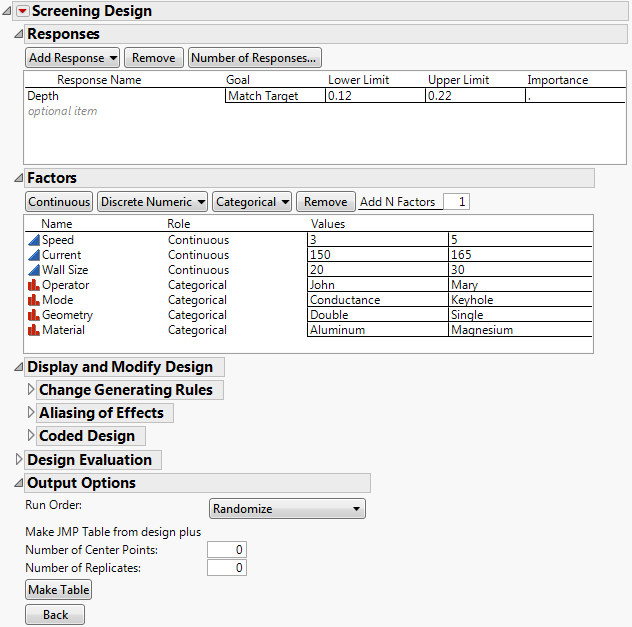
In the Output Options outline, note that Run Order is set to Randomize. This means that the design runs will appear in random order. This is the order you should use to conduct your experimental runs.
Figure 9.4 Completed Screening Design Window
6. Open the Aliasing of Effects outline under Display and Modify Design.
Figure 9.5 Aliasing for an Eight-Run Fractional Factorial Design
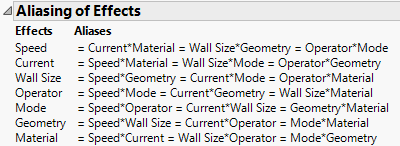
Recall that you selected a Resolution 3 design (Figure 9.3). In a Resolution 3 design, some main effects are confounded with two-way interactions. The Aliasing of Effects outline indicates that, for this Resolution 3 design, every main effect is completely confounded with three two-way interactions. If you suspect that two-way interactions are active, this is a poor design. For a description of confounding, see Two-Level Regular Fractional Factorial.
7. Click Make Table.
Figure 9.6 The Design Data Table
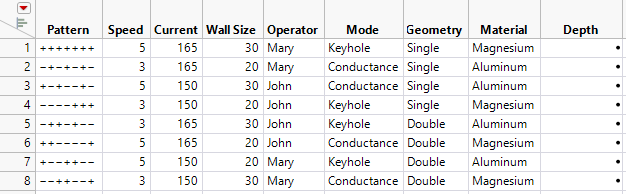
Notice the following:
– The table uses the names for the responses, factors, and levels that you specified.
– The Pattern column shows the assignment of high and low settings for the design runs.
– This fractional factorial design is a Resolution 3 design. It enables you to study the main effects of seven factors in eight runs.
Constructing a Main Effects Screening Design
Main effects screening designs are orthogonal or near orthogonal designs. In this section, construct a main effects screening design for your seven factors.
1. Open your Screening Design window. If you have closed it, then run the DOE Dialog script in the Design Data table.
2. Click Back.
3. Click Continue.
Note: Setting the Random Seed and the Number of Starts in the next two steps reproduces the exact results shown in this example. When constructing a design on your own, these steps are not necessary.
4. (Optional) Click the Screening Design red triangle, select Set Random Seed, type 12345, and click OK.
5. (Optional) Click the Screening Design red triangle, select Number of Starts, type 50, and click OK.
6. In the Choose Screening Type panel, select the Construct a main effects screening design option.
7. Click Continue.
Under Number of Runs, the selected option is Default with the number of runs set to 12. Keep this setting.
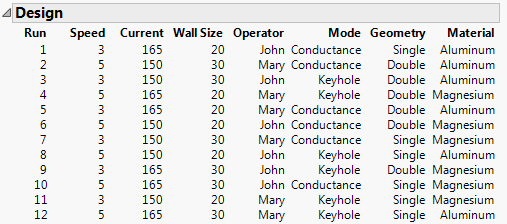
8. Click Make Design.
Figure 9.7 Main Effects Screening Design
9. Open the Design Evaluation outline and then open the Color Map on Correlations outline.
Figure 9.8 Color Map on Correlations for 12-Run Main Effects Screening Design
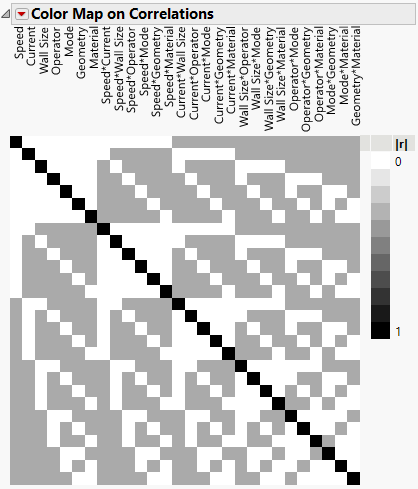
The Color Map on Correlations shows that the main effects are uncorrelated with each other. This is indicated by the white off-diagonal cells in the upper left corner of the color map. Each main effect is partially aliased with some two-way interactions, indicated by the gray cells. You can see, by hovering your cursor above one of the gray cells, that the absolute correlations are 0.333.
In this case, the 12-run main effects screening design is a Plackett-Burman design, which you could have obtained in the Design List. However, in many design situations, the partial aliasing that occurs in a main effects design is preferable to the complete confounding that occurs in a fractional factorial design that you adapt to your experimental situation.
The next section shows an example of a situation where no standard design exists. In this case, JMP constructs a main effects screening design.