Create a Summary Table
To create a summary table, follow these steps:
1. Open a data table.
2. Select Tables > Summary.
3. Highlight the columns that you want to summarize.
Note: For more information about the options in the red triangle menu, see Column Filter Menu in the Get Started section.
4. Add summary statistics, groups, subgroups, frequency variable, weight variable, and select any options needed:
– Use One or More Grouping Columns
– Change the Format of the Statistics Column Name
– Link to the Original Data Table
– Prompt to Save When Closing Linked Summary Tables
– Keep the Summary Window Open
– Create a Two-Way Table of Summary Statistics by Adding a Subgroup Variable
5. Name the summary table by typing a name in the box beside Output table name.
6. Click OK.
Notes:
• When the summary table is linked to the original data table, you cannot edit the data in the summary table, because that would modify and compromise the original data. To edit the data, create a subset of the summary table or save the table, close the table, and reopen it.
• When you select a column that has a Units column property, that value is included in the column header.
Add Summary Statistics
You can add columns that display summary statistics (such as mean, standard deviation, median, and so on) for any numeric column in the source table.
1. In the Summary window, highlight the column that you want to use in calculating the statistics.
2. Click the Statistics button.
3. Select one of the standard univariate descriptive statistics from the Statistics list. The statistics are described in Explanation of Statistics.
Use One or More Grouping Columns
If you want the statistics summarized by group, highlight the column(s) that you want to be your grouping variables and click Group to move the variable into the grouping variables list. See Example of Creating a Summary Table with Groups, for an example. If you add only grouping variables, the summary table shows a count for each group.
To change the order of the grouping variables
To change the order of the grouping variables (ascending or descending order), select a variable in the grouping variable list and click the ascending or descending button ( ). The icon beside the variable changes to indicate the sorting order.
You can also change the order of the grouping variables using the Value Order column property. See Value Order in the The Column Info Window section.
To include marginal statistics
To add marginal statistics (for the grouping variables) to the output columns, click the box beside Include marginal statistics. In addition to adding marginal statistics for each grouping variable, JMP adds rows at the end of the table that summarize each level of the first grouping variable.
1. Select Help > Sample Data Library and open Companies.jmp.
2. Select Tables > Summary.
3. Select Profits ($M) and click Statistics.
4. Select Mean.
5. Select Type and Size Co and click Group.
6. Select Include marginal statistics.
7. Click OK (or Create). See Figure 8.2 at left.
Figure 8.2 Summary Table with and without Marginal Statistics
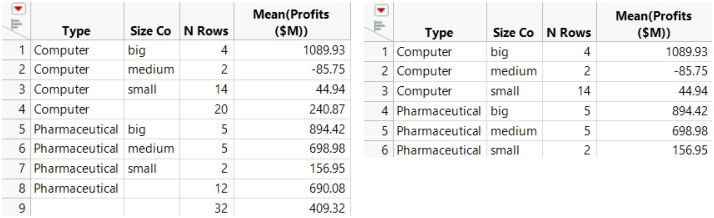
Compare the summary table with marginal statistics (at left) to the summary table without marginal statistics (at right). You can see that the marginal statistics are added, and a row showing that there are 32 total Computer and Pharmaceutical companies.
Use Quantile Statistics
To add specific quantile statistics, follow these steps:
1. In the box under For quantile statistics, enter value (%) type the desired quantile value (%) for the first quantile (for example, 25).
2. Select the applicable column and click Statistics.
3. Select Quantiles.
4. (Optional) Repeat this process for any additional quantiles.
Change the Format of the Statistics Column Name
To change the format of the statistics column name in the summary table, select from one of the formats in the statistics column name format menu. Table 8.1 illustrates the available options. Assume that you are creating a summary table of the mean profits for a company. Your original column name is Profits ($M).
Option | Example |
|---|---|
stat (column) | Mean (Profits ($M)) |
column | Profits ($M) |
stat of column | Mean of Profits ($M) |
column stat | Profits ($M) Mean |
stat | N |
Link to the Original Data Table
You can select whether to link the summary table to the original data table. By default, the Link to original data table option is selected. If you want to edit the data in the summary table, deselect the Link to original data table option. When the summary table is linked to the original data table, you cannot edit the data in the summary table, because that would modify and compromise the original data. To edit the data, create a subset of the summary table or save the table, close the table, and reopen it.
Within linked tables, if you drag columns from the summary table into the column heading of a new column in the original data table, the values are expanded as if they were matched by grouping columns.
Prompt to Save When Closing Linked Summary Tables
To be prompted to save an unsaved linked summary table when you close it, select Prompt to save when closing summary tables. When you select this option in the Summary window, it is selected in the Tables preferences. If you do not want to be prompted to save linked summary tables in the future, deselect the preference.
Keep the Summary Window Open
If you select the Keep dialog open option, the Summary window remains open after you click Create. Notice that once you select this option, the OK button is replaced by a Create button.
Create a Two-Way Table of Summary Statistics by Adding a Subgroup Variable
1. Highlight the column(s) that you want to be the nested variable(s). These are your “subgroup variable(s).”
2. Click Subgroup to move the variable(s) into the subgroup list.
3. Highlight the column for which you want statistics summarized by subgroup.
4. In the Statistics list, select the specific statistic that you want.
5. Click OK.
For more information about the types of statistics, see Explanation of Statistics.