Design That Estimates Main Effects Only
Note: For more information about main effects only screening designs, see Screening Designs.
In this example, you are interested in studying the main effects of six factors. You construct a screening design where all of the main effects are orthogonal. However, the main effects are aliased with two-factor interactions.
1. Select DOE > Custom Design.
2. In the Factors outline, type 6 next to Add N Factors.
3. Click Add Factor > Continuous.
4. Click Continue.
The Model outline appears. It includes only main effects with Estimability designated as Necessary. This means that all main effects are estimable in the design that is generated.
Figure 5.2 Custom Design Window Showing Model Outline
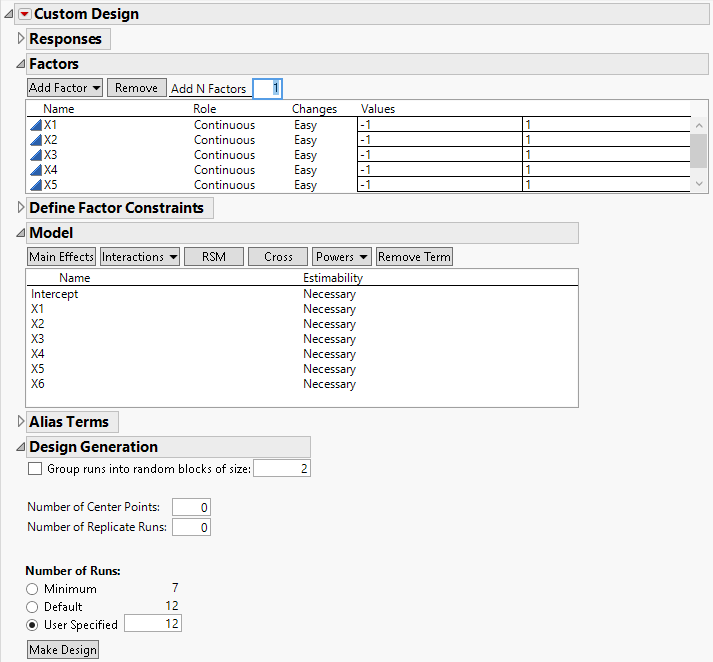
Keep the default of 12 runs.
Note: Setting the Random Seed in step 5 and Number of Starts in step 6 reproduces the exact results shown in this example. When constructing a design on your own, these steps are not necessary.
5. (Optional) Click the Custom Design red triangle, select Set Random Seed, type 12345, and click OK.
6. (Optional) Click the Custom Design red triangle, select Number of Starts, type 1, and click OK.
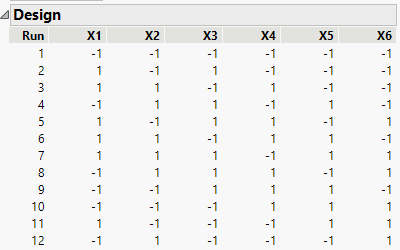
7. Click Make Design.
Figure 5.3 Design for Main Effects Only
8. Open the Design Evaluation > Color Map on Correlations outline.
Figure 5.4 Color Map on Correlations
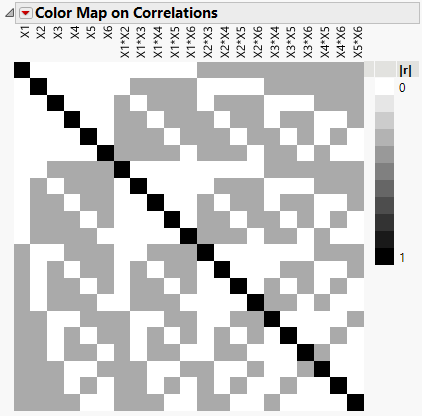
Notice the following:
– The main effects are represented by the six terms in the upper left corner of the map.
– The white coloring corresponding to the correlations of the six main effects with other main effects indicates correlations of 0. This means that all main effects are orthogonal and can be estimated independently of each other.
– The light gray color in the squares corresponding to some two-way interactions indicates that the corresponding effects are correlated. This means that these effects cannot be estimated independently of other effects. Place your cursor over these squares to see the exact correlation.
– Notice that no effects are completely confounded with each other. The black squares, indicating absolute correlations of 1, are only on the main diagonal.
9. Open the Design Evaluation > Alias Matrix outline.
Figure 5.5 Alias Matrix
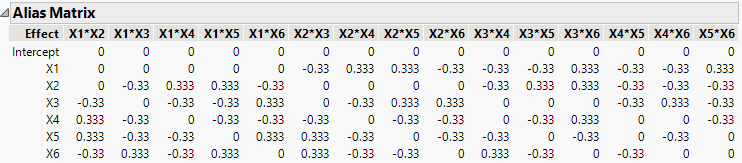
The Alias Matrix shows how the coefficients of the main effect terms in the model are biased by potentially active two-factor interaction effects. The column labels identify interactions. For example, in the X1 row, the column X2*X3 has a value of -0.33 and the column X2*X4 has a value of 0.333. This means that the expected value of the main effect of X1 is the sum of the main effect of X1 plus -0.33 times the effect of X2*X3, plus 0.333 times the effect of X2*X4, and so on, for the rest of the X1 row. In order for the estimate of the main effect of X1 to be meaningful, you must assume that these interactions are negligible in size compared to the effect of X1.
Tip: The Alias Matrix is a generalization of the confounding pattern in fractional factorial designs.