Designs of Same Run Size
In this example, you compare two designs for six factors each with 13 runs. One is a 12-run Plackett-Burman (PB) design augmented with a single center point. The other is a Definitive Screening Design (DSD).
Comparison in Terms of Main Effects Only
First, compare the two designs assuming that the model to be estimated contains only the main effects.
1. Select Help > Sample Data, click Open the Sample Scripts Directory, and select Compare Same Run Size.jsl.
2. Right-click in the script window and select Run Script.
Two 13-run design tables are constructed: Definitive Screening Design and Plackett-Burman. You want to compare these two designs. Because the Plackett-Burman table is active, it is the reference design to which you compare the DSD.
3. In the Plackett-Burman data table, select DOE > Design Diagnostics > Compare Designs.
4. Select Definitive Screening Design from the Compare ‘Plackett-Burman’ with list.
5. Select X1 through X6 in the Plackett-Burman panel and in the Definitive Screening Panel.
6. Open the Match Columns outline and click Match.
Figure 16.2 Launch Window with Matched Columns
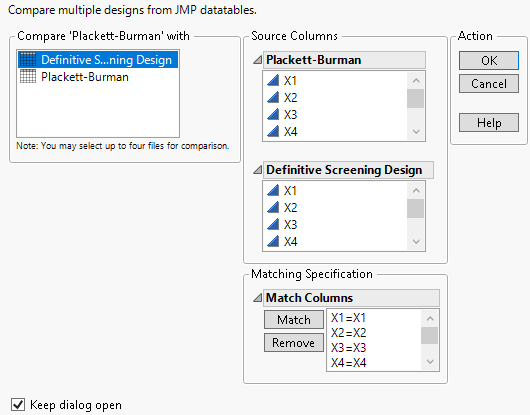
This defines the correspondence between the factors in your two designs.
7. Click OK.
The reference design is the Plackett-Burman design. In the Design Evaluation outline, comparison metrics compare the PB to the DSD. The designs are compared relative to power, prediction variance, estimation efficiency, aliasing, and design efficiency measures.
Figure 16.3 Power Analysis for PB and DSD Comparison
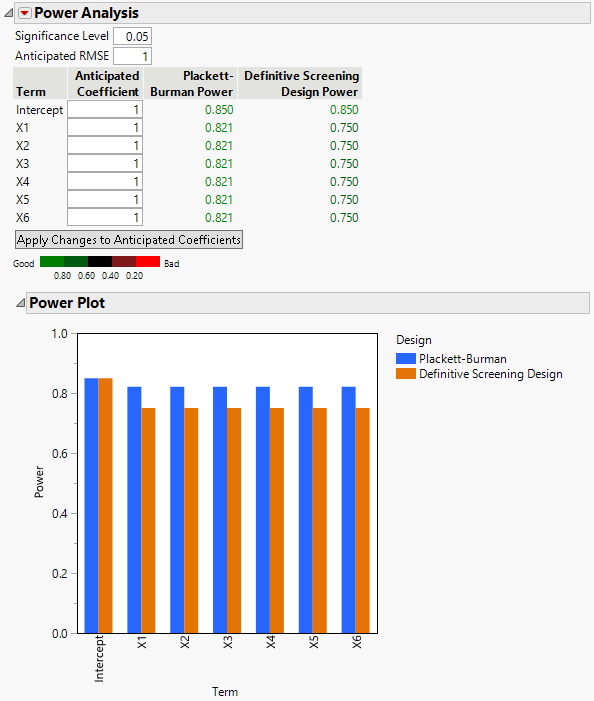
In terms of power, prediction variance, and estimation efficiency, the PB design outperforms the DSD. Figure 16.3 shows the Power Analysis report with the default settings for the significance level, Anticipated RMSE, and coefficients. For tests for the main effects, the PB design has higher power than does the DSD.
Figure 16.4 Fraction of Design Space Plot for PB and DSD Comparison
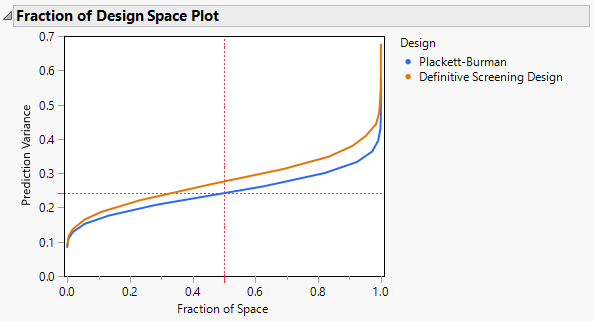
The Fraction of Design Space plot indicates that the PB design has smaller prediction variance than the DSD over the entire design space.
You conclude that, if you suspect that only main effects are active, the PB design is preferable.
Comparison in Terms of Two-Way Interactions
Now suppose you suspect that some two-way interactions might be active. The analysis below shows that if those two-way interactions are actually active, then the PB design might be less desirable than the DSD.
1. In the Absolute Correlations report, open the Color Map on Correlations report and the color map reports under it.
Figure 16.5 Color Maps for PB and DSD Comparison
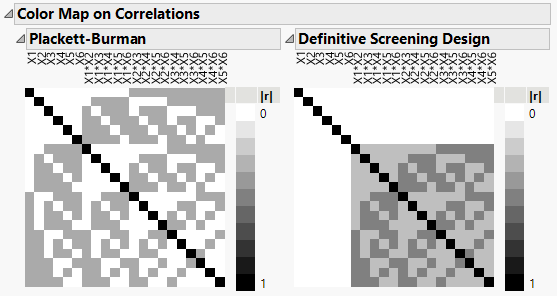
The Color Map on Correlations plots show that the PB design aliases main effects with two-way interactions. In contrast, the DSD does not alias main effects with two-way interactions.
To gain more insight on how the designs compare if some two-way interactions are active, add two-way interactions in the Model outline.
2. In the Factors outline, select X1 through X3.
3. In the Model outline, select Interactions > 2nd.
Figure 16.6 Power Analysis for PB and DSD Comparison with Interactions
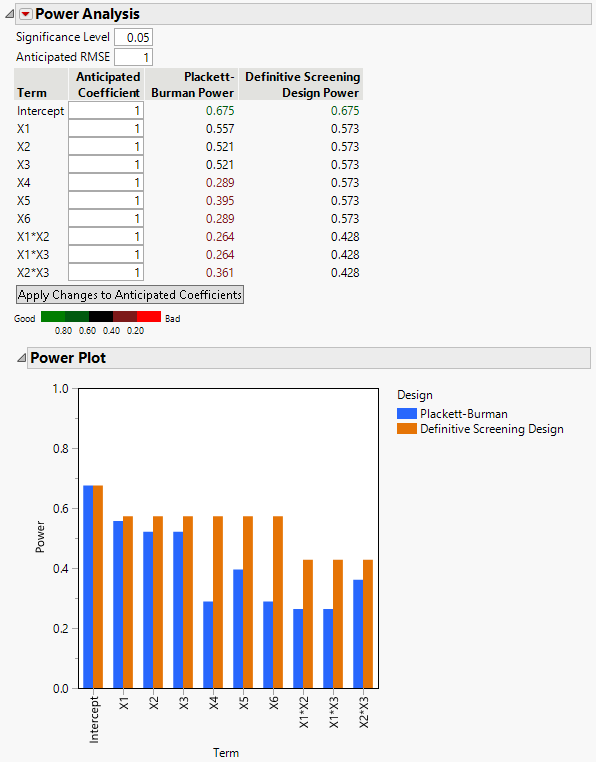
The Term list shows the three two-way interactions. If these two-way interactions are active, then the DSD has better performance in terms of power across all effects than the PB.
Figure 16.7 Prediction Variance for PB and DSD Comparison with Interactions
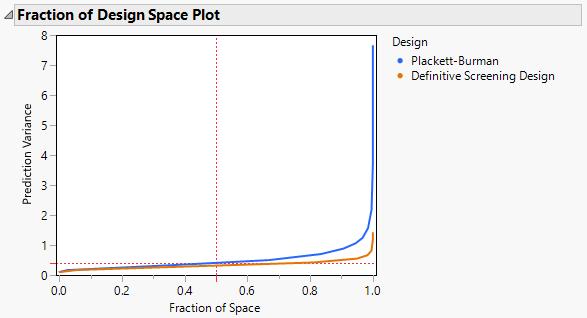
The DSD also outperforms the PB design in terms of prediction variance with the three interactions in the model. You can explore the other reports to see that the DSD is preferred when there are potentially active interactions.