Desirability Profiling and Optimization
You can define a desirability function for a single response variable or for several response variables. When you are optimizing relative to several responses, there can often be competing criteria. For example, you might want to maximize one response, minimize another, and keep a third response close to some target value.
In desirability profiling, you specify a desirability function for each response. The overall desirability for all responses is defined as the geometric mean of the desirability functions for the individual responses. See Derringer and Suich (1980) for information about combining responses.
To use desirability profiling, select Optimization and Desirability > Desirability Functions from the Prediction Profiler red triangle menu.
Note: If the response column has a Response Limits property, desirability functions are turned on by default.
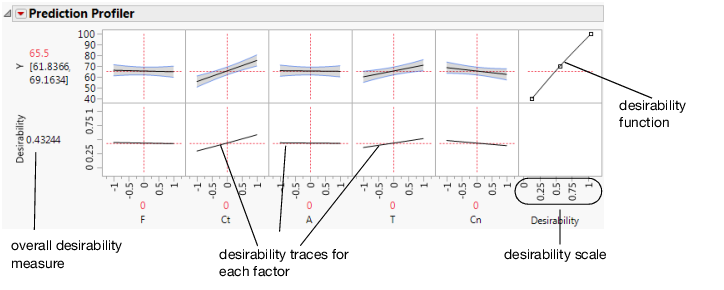
This command appends a new row to the bottom of the plot matrix, dedicated to graphing desirability. The row has a plot for each factor showing its desirability trace, as illustrated in Figure 3.9. It also adds a column that has an adjustable desirability function for each Y variable. The overall desirability measure shows on a scale of zero to one at the left of the row of desirability traces.
Figure 3.9 The Desirability Prediction Profiler