Draw Regular Shapes: Circles, Rectangles, and Ovals
Circles
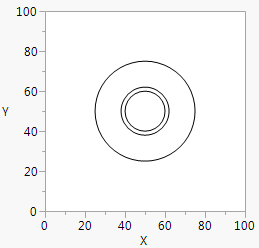
Circle() draws a circle with the center point and radius given. Subsequent arguments specify additional radii.
win = New Window( "Circles",
Graph Box( Frame Size( 200, 200 ),
Circle( {50, 50}, 10, 12, 25 )
)
);
Circle() also has a final optional argument, "fill". This string indicates that all circles defined in the function are filled with the current fill color. If "fill" is omitted, the circle is empty.
Figure 12.15 Drawing Circles
Note that a circle is always a circle, even if you resize the graph to a different aspect ratio. If you want your circle to change aspect ratios (in other words, cease being a circle) when the graph is resized, use an oval instead.
If you do not want your circle to resize if the graph is resized, specify the radius in pixels instead:
win = New Window( "Circles",
Graph Box(Frame Size( 200, 200 ),
Circle( {50, 50}, Pixel Radius( 10 ), Pixel Radius( 12 ), Pixel Radius( 25 ) )
)
);
Rectangles
Rect() draws a rectangle from the diagonal coordinates you specify. The coordinates can be specified either as four arguments in order (left, top, right, bottom), or as a pair of lists ({left, top}, {right, bottom}).
win = New Window( "Rectangles",
Graph Box(Frame Size( 200, 200 ),
Pen Color( 1 );
Rect( 0, 40, 60, 0 );
Pen Color( 3 );
Rect( 10, 60, 70, 10 );
Pen Color( 4 );
Rect( 50, 90, 90, 50 );
Pen Color( 5 );
Rect( 0, 80, 70, 70 );
)
);
Rect() has an optional fifth argument, fill. Specify 0 to get an unfilled rectangle and 1 to get a filled rectangle. The default value for fill is 0. The rectangle is filled with the current fill color.
Any negative fill argument produces an unfilled frame inset by one pixel:
win = New Window( "Framed Rectangle",
Graph Box( Frame Size( 200, 200 ), Rect( 0, 40, 60, 0, -1 ) )
);
Ovals
Oval() draws an oval inside the rectangle given by its x1, y1, x2, and y2 arguments:
win = New Window( "Ovals",
Graph Box(Frame Size( 200, 200 ),
Pen Color( 1 );
Oval( 0, 40, 60, 0 );
Pen Color( 3 );
Oval( 10, 60, 70, 10 );
Pen Color( 4 );
Oval( 50, 90, 90, 50 );
Pen Color( 5 );
Oval( 0, 80, 70, 70 );
)
);
Oval() also has an optional fifth argument, fill. Specify 0 to get an unfilled rectangle and 1 to get a filled oval. The default value for fill is 0. The oval is filled with the current fill color.
Figure 12.16 shows rectangles and ovals, drawn both filled and unfilled. Notice that filled rectangles do not have outlines. Ovals do have outlines. If you want a filled rectangle with an outline, you must draw the filled rectangle and then draw an unfilled rectangle with the same coordinates.
Figure 12.16 Rectangles and Ovals, Unfilled and Filled