Example of Clustering
In this example, we group together countries by their 1976 crude birth and death rates per 100,000 people.
1. Select Help > Sample Data Library and open Birth Death Subset.jmp
2. Select Analyze > Clustering > Hierarchical Cluster.
3. Select birth and death and click Y, Columns.
4. Select country and click Label.
This selection ensures that the country column, rather than the row number, is used to label the dendrogram that appears when you click OK.
5. Click OK.
6. Click the Hierarchical Clustering red triangle and select Color Clusters.
Figure 12.2 Hierarchical Clustering Report
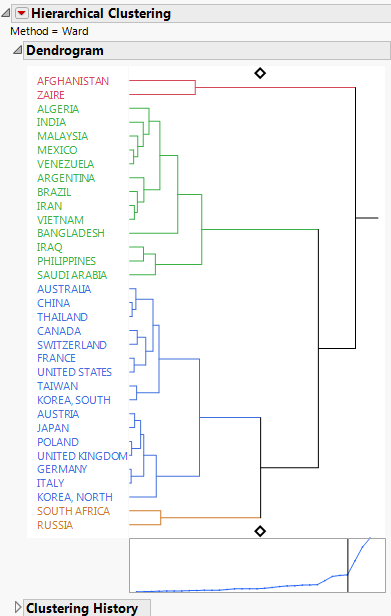
The dendrogram shows how the clustering is conducted. The clustering process can be viewed by reading the dendrogram from left to right. Each step consists of combining the two closest clusters into a single cluster.
In the dendrogram, the relative distances between clusters are given by the horizontal distances between vertical lines that join the clusters. For example, Afghanistan and Zaire differ more than Malaysia differs from the cluster consisting of Mexico and Venezuela.
The plot that appears beneath the dendrogram has a point for each step where two clusters are joined into a single cluster. The horizontal coordinates represent the numbers of clusters and they decrease from left to right. The vertical coordinate of the point is the distance between the two clusters that are joined to form the specified number of clusters. You can click either diamond in the dendrogram and drag the line to choose the number of clusters that best represent the data. You can also use the Number of Clusters option in the Hierarchical Clustering red triangle menu to choose the number of clusters.
The distance graph has a noticeable change in slope at four clusters. The change in slope indicates that the differences in clusters that are joined up to the point where four clusters remain, are comparatively small. This suggests that four is a good choice for the number of clusters. Note that this is the number of clusters that was shown by default.
7. Click the Hierarchical Clustering red triangle and select Constellation Plot.
Figure 12.3 Constellation Plot
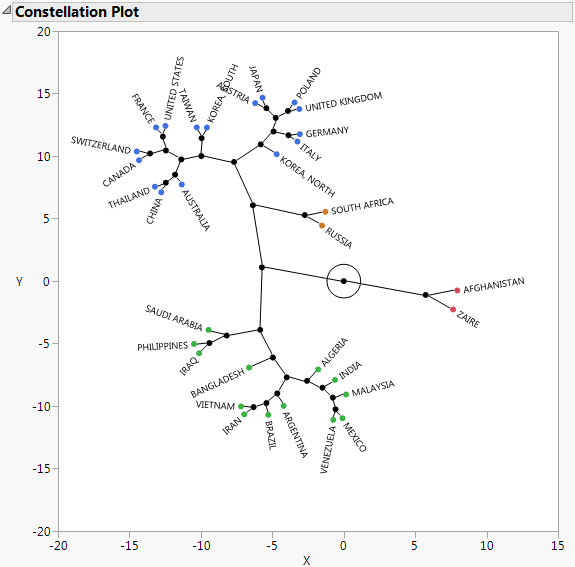
This constellation plot arranges the countries as endpoints and each cluster join as a new point. The lines represent membership in a cluster. The length of a line between cluster joins approximates the distance between the clusters that were joined. The constellation plot indicates that the cluster that contains Afghanistan and Zaire is about as distant from the cluster of remaining countries as are the two clusters that consist of the remaining countries in the upper half of the plot and those in the lower half of the plot.