Example of Creating a Dashboard from Two Data Tables
The graphs or reports in a dashboard can be created from multiple data tables. The data table used for the first graph on the dashboard is considered the current data table by default. This gives the user the flexibility to use any current data table to create the graph or report. The dashboard author can also hard-code the path. Specifying the name gives the dashboard author control over which data table is used.
1. Select Help > Sample Data Library, open Big Class.jmp, and run the Bivariate script.
2. Select Help > Sample Data Library, open Hollywood Movies.jmp, and run the Distribution script.
3. From any JMP window, select File > New > Dashboard.
4. In Dashboard Builder, select the 2 x 1 Dashboard template.
5. Double-click the Distribution graph to add it to the dashboard first.
By default, this graph uses whatever data table is the current data table. In this example, Hollywood Movies.jmp stored in the Samples/Data folder is the current data table.
6. Double-click the Bivariate graph to add it to the dashboard.
You are prompted to determine whether the first graph uses the current data table or whether you want to hard-code the path to the data table (reference the table by name) in the dashboard.
7. Select Reference table by name to make sure the specified data table is always used to create the graph.
8. Click OK.
In this example, Hollywood Movies.jmp in the Samples/Data folder will always be used as the current data table for the first graph, despite the current data table that is open.
Tip: Sometimes a named data table cannot be found when the dashboard is run. This is particularly common when the dashboard is moved to a different computer. You can either open the data table before running the dashboard or run the dashboard and select the data table when prompted.
To Change the Location of the Data Table
After you assign the location of the data table (current data table or name), you can change the setting in the dashboard Objects and Properties panes.
1. Click the Dashboard Builder red triangle and select Show Properties.
Figure 11.17 The Objects and Properties Panes
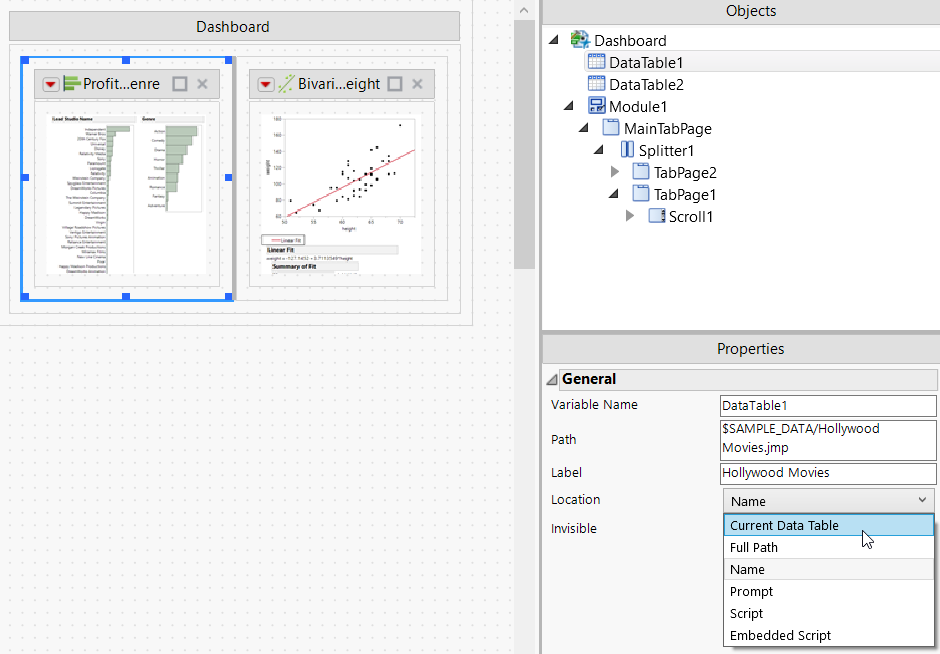
2. In the Objects pane, select DataTable1.
3. In the Properties pane, change the Location as shown in Figure 11.17.
For example, if you change the Name location to Current Data Table, the selected graph on the dashboard is based on the current data table.
Note: The Location value of Current Data Table applies only when you are running the dashboard. When you are editing the dashboard, Dashboard Builder uses the full path to locate the data table.