Example of CUSUM Control Chart
You want to detect small shifts in the temperature of an engine. The data table contains temperature measurements from the engine thermostat.
1. Select Help > Sample Data Library and open Quality Control/Engine Temperature Sensor.jmp.
2. Select Analyze > Quality and Process > Control Chart > CUSUM Control Chart.
3. Select Y and click Y.
4. Click OK.
5. In the Target box, type 100.
6. In the Sigma box, type 10.
Figure 8.2 CUSUM Control Chart Report
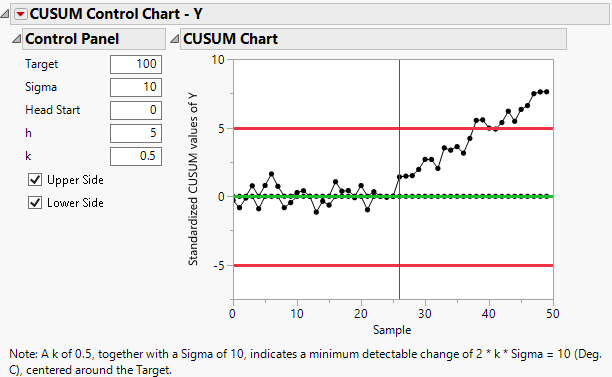
The vertical line on the CUSUM Chart indicates that a shift in the temperature measurements started around sample 26.
Note: You can compare this result to the Individual Moving Range control chart by running the IMR Chart table script in Engine Temperature Sensor.jmp. The IMR chart does not trigger any of the Nelson tests.