CUSUM Control Charts
Create Tabular CUSUM Control Charts with Decision Limits
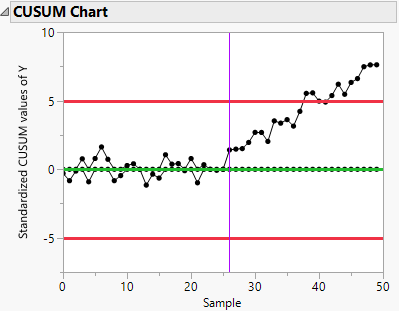
Cumulative Sum (CUSUM) control charts enable you to detect small shifts in a process. They are useful in detecting shifts that occur over time, such as a gradual drift, and that are not necessarily accompanied by a sudden shift. The CUSUM Control Chart platform creates a CUSUM chart with decision limits, similar to a Shewhart chart. This chart is also called a tabular CUSUM chart. To create a V-mask cumulative sum control chart, see V-Mask CUSUM Control Charts.
The CUSUM Control Chart platform also provides information about average run length (ARL). The average run length is the average number of samples or observations that can be expected to occur before an out-of-control signal occurs. You can use the average run length to assess the performance of a CUSUM chart, given specific parameters and assuming constant variance.
Figure 8.1 CUSUM Control Chart