Launch the CUSUM Control Chart Platform
Launch the CUSUM Control Chart platform by selecting Analyze > Quality and Process > Control Chart > CUSUM Control Chart.
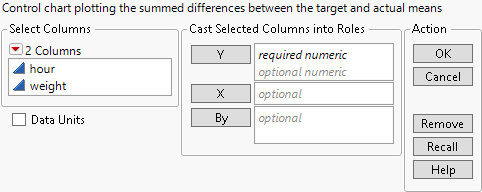
Figure 8.3 The CUSUM Control Chart Launch Window
For more information about the options in the Select Columns red triangle menu, see Column Filter Menu in Using JMP.
The CUSUM Control Chart platform launch window contains the following options:
Y
Identifies the variables that you want to chart.
Note: The rows of the data table must be sorted in the order in which you want them to appear in the control chart.
X
Identifies a subgroup variable whose values label the horizontal axis. If a value of this column is present more than once, the average response at each X value is plotted on the CUSUM chart.
By
Produces a separate report for each level of the By variable. If more than one By variable is assigned, a separate report is produced for each possible combination of the levels of the By variables.
Data Units
Specifies that data units be used in the report rather than standard deviation units. By default, the chart and parameters are shown in standard deviation units. However, if you select the Data Units option in the launch window, the chart and parameters are shown in the units of the data column that is being analyzed.
When you use standard deviation units, values for the h and k parameters do not depend on the process standard deviation. This can be an advantage.