Statistical Details for CUSUM Control Chart Construction
This section defines the statistics that are used in the construction of the CUSUM Chart. Some of these statistics are also saved in the data table that is created by the Save Summaries command.
One-Sided Upper and Lower Cumulative Sums
The definitions of C+ and C- depend on the setting of the Data Units option.
Note: In the Save Summaries data table, C+ and C- are labeled Upper Cumulative Sum and Lower Cumulative Sum, respectively.
Cumulative Sums in Standardized Units
If the Data Units option is not selected, C+ and C- for each step are defined as follows:
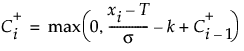
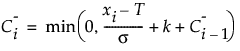
where:
xi is the value of the response at the ith step
T is the target of the process
σ is the standard deviation of the process
k is the reference value, in units of standard deviations
If a value is specified for Head Start, that value is used as the initial C+ value and the negative of that value is used as the initial C- value. Otherwise, the initial values of C+ and C- are zero.
Cumulative Sums in Data Units
If the Data Units option is selected, C+ and C- for each step are defined as follows:
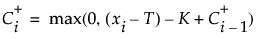
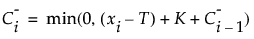
where:
xi is the value of the response at the ith step
T is the target of the process
σ is the standard deviation of the process
K is the reference value, in units of the data
If a value is specified for Head Start, that value is used as the initial C+ value and the negative of that value is used as the initial C- value. Otherwise, the initial values of C+ and C- are zero.
Counters for Positive and Negative Runs
N+ at each step is the number of steps since the most recent zero value for C+. N- at each step is the number of steps since the most recent zero value for C-.
Note: In the Save Summaries data table, N+ and N- are labeled Positive Runs and Negative Runs, respectively.