Example of Predictor Screening
The Bands Data.jmp data table contains measurements from machinery in the rotogravure printing business. The data set contains 539 records and 38 variables. The response Y is the column Banding? and its values are “BAND” and “NOBAND”. You are interested in understanding what properties are most likely to contribute to the response.
1. Select Help > Sample Data Library and open Bands Data.jmp.
2. Select Analyze > Screening > Predictor Screening.
3. Select Banding? as Y, Response.
4. Select the grouped columns grain screened to chrome content and click X.
5. Click OK.
Figure 23.2 Ranked Column Contributions
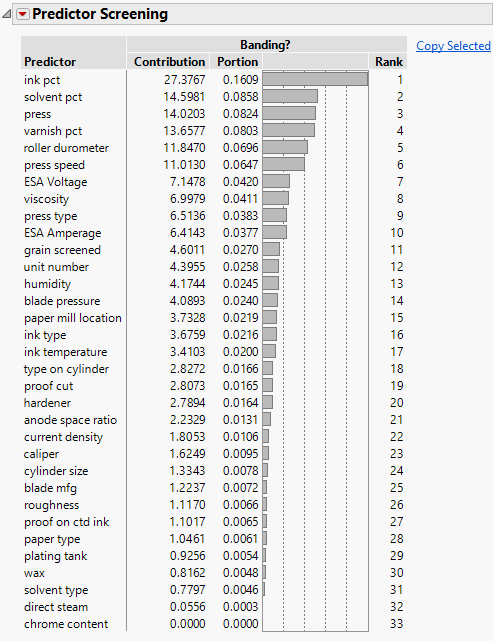
Note: Because this analysis is based on the Bootstrap Forest method that has a random selection component, your results can differ slightly from those in Figure 23.2. See Bootstrap Forest.
The columns are sorted and ranked in order of contribution in the bootstrap forest model. Predictors with the highest contributions are strong candidate predictors for the response of interest.