Example of the Fit Orthogonal Option
This example involves two parts. First, standardize the variables using the Distribution platform. Then, use the standardized variables to fit the orthogonal model.
Standardize the Variables
1. Select Help > Sample Data Library and open Big Class.jmp.
2. Select Analyze > Distribution.
3. Select height and weight and click Y, Columns.
4. Click OK.
5. Hold down the Ctrl key. Click the height red triangle and select Save > Standardized.
Holding down the Ctrl key broadcasts the operation to all variables in the report window. Notice that in the Big Class.jmp sample data table, two new columns have been added.
6. Close the Distribution report window.
Use the Standardized Variables to Fit the Orthogonal Model
1. From the Big Class.jmp sample data table, select Analyze > Fit Y by X.
2. Select Std weight and click Y, Response.
3. Select Std height and click X, Factor.
4. Click OK.
5. Click the red triangle next to Bivariate Fit of Std weight By Std height and select Fit Line.
6. Click the red triangle next to Bivariate Fit of Std weight By Std height and select Fit Orthogonal. Then select each of the following:
– Equal Variances
– Fit X to Y
– Specified Variance Ratio and type 0.2.
– Specified Variance Ratio and type 5.
Figure 5.21 Example of Orthogonal Fitting Options
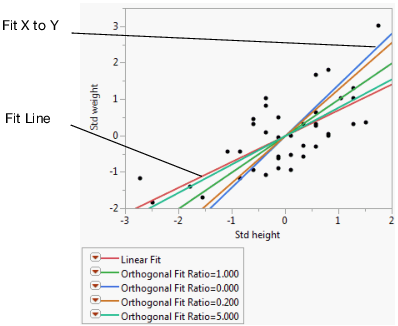
The scatterplot in Figure 5.21 shows the standardized height and weight values with various line fits that illustrate the behavior of the orthogonal variance ratio selections. The standard linear regression (Fit Line) occurs when the variance of the X variable is considered to be very small. Fit X to Y is the opposite extreme, when the variation of the Y variable is ignored. All other lines fall between these two extremes and shift as the variance ratio changes. As the variance ratio increases, the variation in the Y response dominates and the slope of the fitted line shifts closer to the Y by X fit. Likewise, when you decrease the ratio, the slope of the line shifts closer to the X by Y fit.