Example Using the Contour Platform
To create a contour plot, you need two variables for the x- and y-axes and at least one more variable for contours. You can also use several y-variables. This example uses the Little Pond.jmp sample data table. X and Y are coordinates of a pond. Z is the depth.
1. Select Help > Sample Data Library and open Little Pond.jmp.
2. Select Graph > Contour Plot.
3. Select the X and Y coordinates and click X.
4. Select the depth, Z, and click Y.
Note: In a contour plot, the X1 and X2 roles are used for the X and Y axes.
5. Click OK.
Figure 10.2 Example of a Contour Plot with Legend
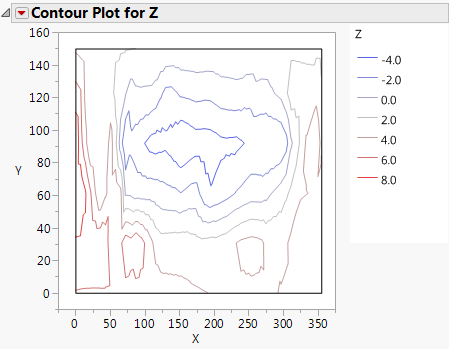
The x- and y-axes are coordinates and the contour lines are defined by the depth variable. This contour plot is essentially a map of a pond showing depth. To see the contours more clearly, click the red triangle next to Contour Plot for Z and select Fill Areas.