Fraction of Design Space Plot
The Fraction of Design Space Plot shows the proportion of the design space over which the relative prediction variance lies below a given value.
Figure 16.25 Fraction of Design Space Plot for Three Designs
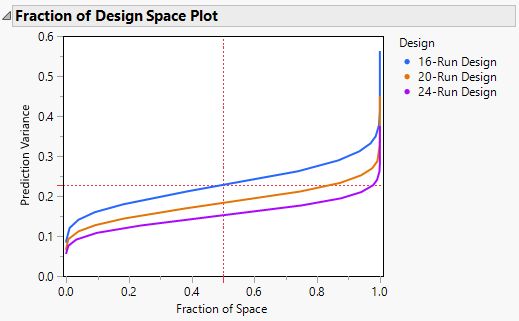
Figure 16.25 shows the Fraction of Design Space plot for the three designs constructed in Designs of Different Run Sizes. Note the following:
• The X axis in the plot represents the proportion of the design space, ranging from 0 to 100%.
• The Y axis represents relative prediction variance values.
• For a point (x, y) that falls on a given curve, the value x is the proportion of design space with variance less than or equal to y.
• Red dotted crosshairs mark the value that bounds the relative prediction variance for 50% of design space for the reference design.
Figure 16.25 shows that the relative prediction variance for the 24-run design is uniformly smaller than for the other two designs. The 20-run design has uniformly smaller prediction variance than the 16-run design. The red dotted crosshairs indicate that the relative prediction variance for the 20-run design is less than about 0.23 over about 50% of the design space.
You can use the crosshairs tool to find the maximum relative prediction variance that corresponds to any Fraction of Space value. For example, use the crosshairs tool to see that for the 24-run design, 90% of the prediction variance values are below approximately 0.20.
Note: Plots for the same design might vary slightly, since Monte Carlo sampling of the design space is used in constructing the Fraction of Design Space Plot.