Launch the Contour Plot Platform
Launch the Contour Plot platform by selecting Graph > Contour Plot.
By default, the contour levels used in the plot are values computed from the data. You can specify your own number of levels and level increments in the Launch window before you create the plot. You can also do so in the red triangle menu for Contour Plot after you create the plot. You can use a column formula to compute the contour variable values.
Figure 10.4 The Contour Plot Launch Window
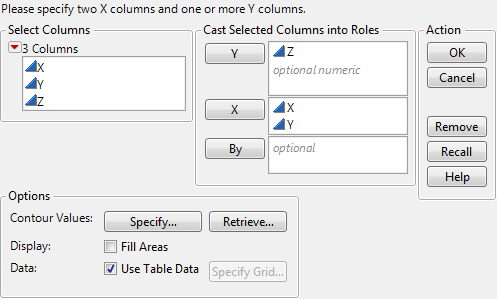
Y
Columns assigned to the Y role are used as variables to determine the contours of the plot. You must specify at least one, and you can specify more than one.
You can also assign a column with a formula to this role. If you do so, the formula should be a function of exactly two variables. Those variables should be the x variables entered in the Launch window.
X
Columns assigned to the X role are used as the variables for the x- and y-axes. You must specify exactly two columns for X.
By
This option produces a separate graph for each level of the By variable. If two By variables are assigned, a separate graph for each possible combination of the levels of both By variables is produced.
Options
Contour Values
Specify your own number of levels and level increments. See Contour Specification.
Fill Areas
Fill the areas between contour lines using the contour line colors.
Use Table Data and Specify Grid
Most often, you construct a contour plot for a table of recorded response values. In that case, Use Table Data is selected and the Specify Grid button is unavailable.
However, if a column has a formula and you specify that column as the response (Y), the Specify Grid button becomes available. When you click Specify Grid, you can define the contour grid in any way, regardless of the rows in the existing data table. This feature is also available with table templates that have one or more columns defined by formulas but no rows. See Use Formulas for Specifying Contours.
After you click OK, the Contour plot appears. See The Contour Plot.